LAB Price Prediction: $LAB Whale Control 99.85%, Buy or Stay Away?


$LAB is back in focus this week, not just for its recent MoonPay onramp launch but for what on-chain data reveals about who actually holds the token.
Fresh BscScan analytics show the top 100 wallets control 99.86% of the total supply, with a single wallet alone holding just over 20%. LAB positions itself as a platform aimed at making it easier to move from fiat directly into on-chain trading.
This LAB Price Prediction looks at how this concentration lines up against the current chart setup and what it could mean for holders. Keep reading to see how the levels and the whale data stack up.
LAB Price Today: Market Overview
Metric | Value |
Price (LAB/USD) | $0.15304 |
24h Change | +3.59% |
24h Range | $0.1443 - $0.1651 |
Market Cap | $47.67M (+4.14%) |
Fully Diluted Valuation | $153.71M |
24h Trading Volume | $33.7M (70.26% of market cap) |
Circulating Supply | 312.09M LAB |
Total Supply | 990M $LAB |
Max Supply | 1B $LAB |
Holders | 27.91K |
Source: Data from CoinMarketCap as of July 25, 2026. Figures may vary slightly across other tracking websites.
LAB Whale Concentration: On-Chain Holder Data
On-chain analytics from BscScan paint a picture of extremely concentrated ownership.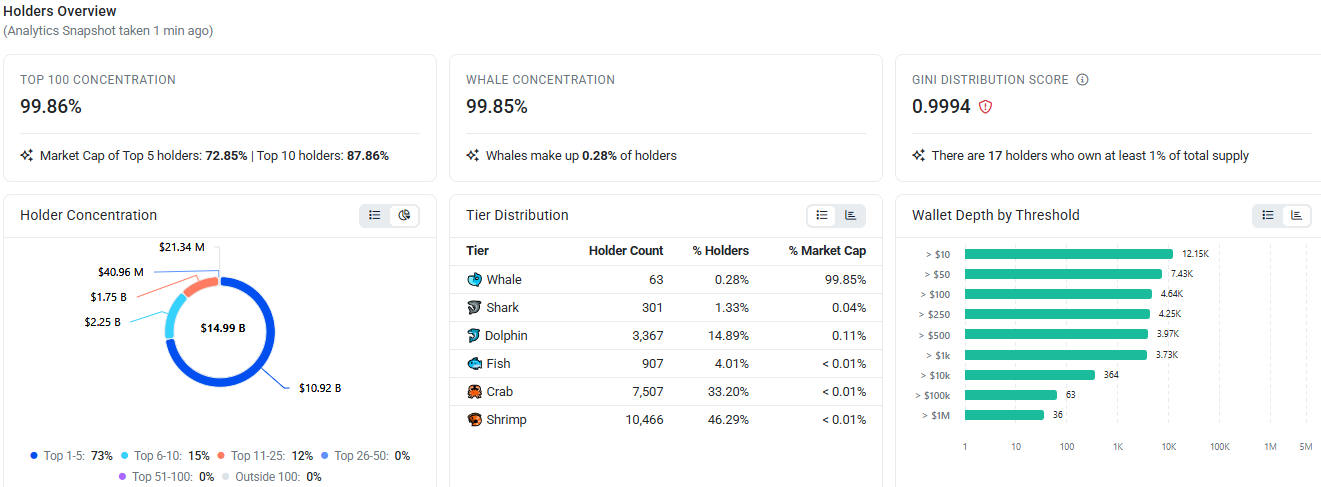
The top 100 wallets hold 99.86% of total supply, and whales, who make up just 0.28% of all holders, control 99.85% of the market cap between them.
The Gini distribution score sits at 0.9994, close to the maximum possible concentration score of 1, and 17 individual holders each own at least 1% of total supply.
Breaking this down further, the top 5 wallets alone account for 72.85% of market cap, and the top 10 account for 87.86%. The single largest wallet holds 200,000,000 LAB, or 20.20% of the supply, and is worth approximately $30.6M at the current price.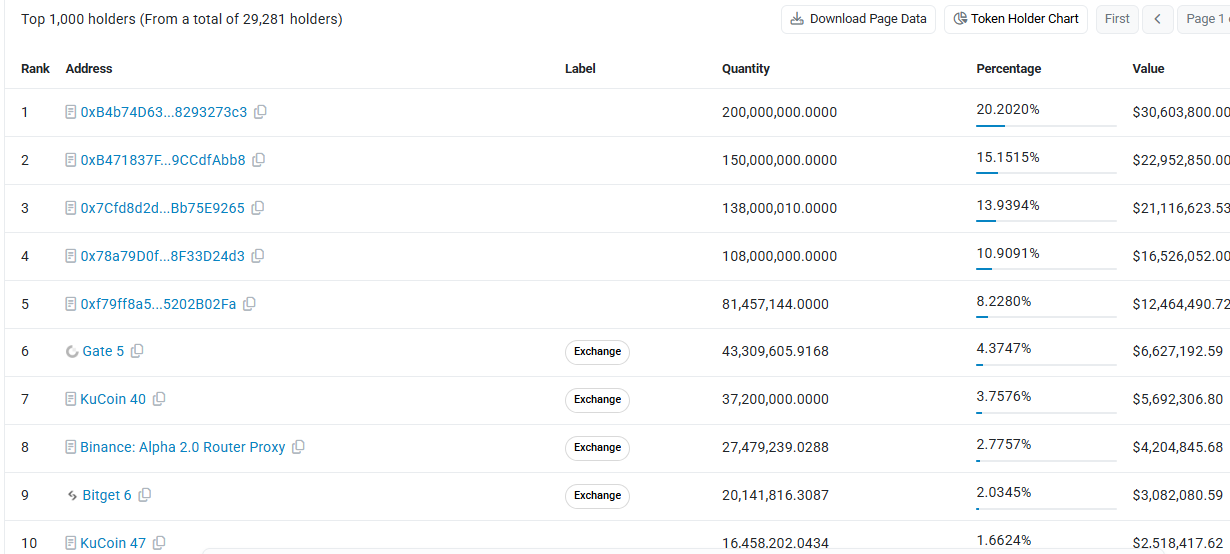
The next four largest wallets hold 15.15%, 13.94%, 10.91%, and 8.23%, respectively.
Several exchange-labeled wallets also appear further down the list, including Gate at 4.37%, KuCoin at 3.76%, a Binance Alpha 2.0 Router Proxy at 2.78%, Bitget at 2.03%, and another KuCoin wallet at 1.66%.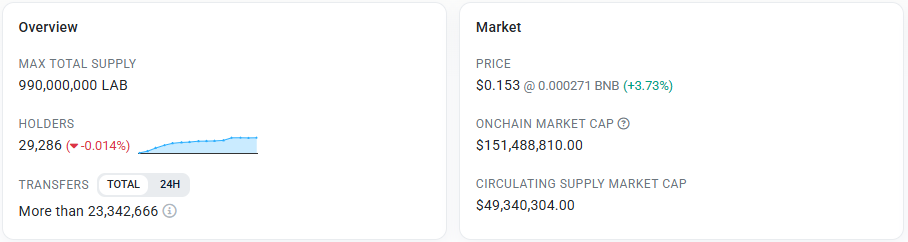
On-chain market cap based on circulating supply is listed at $49,340,304 on BscScan, close to the $47.67M figure from CoinMarketCap, with only minor variance between the two sources.
Source: Data from BscScan as of July 25, 2026.
This level of concentration means price action can be influenced disproportionately by the decisions of a small number of wallets, independent of the broader retail trend or technical setup.
Liquidation and Volume Data
The liquidation profile remains tilted toward longs across most timeframes, though by a narrower margin than before. In the last hour, $5.79K was liquidated, with $4.93K from longs against $853.61 in shorts.
Over 4 hours, $35.10K was liquidated, with $32.06K from longs versus $3.04K in shorts. Over 12 hours, $72.13K was liquidated, more evenly split at $38.76K in longs against $33.37K in shorts.
Across the full 24 hours, $172.63K was liquidated, with $101.30K in longs against $71.33K in shorts.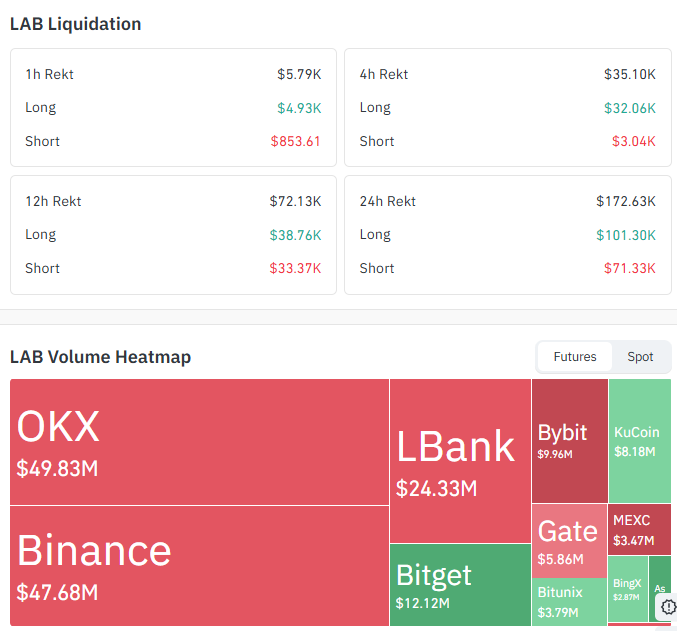
Source: Data From CoinGlass
Futures volume is led by OKX at $49.83M and Binance at $47.68M, followed by LBank at $24.33M, Bitget at $12.12M, Bybit at $9.96M, KuCoin at $8.18M, Gate at $5.86M, Bitunix at $3.79M, MEXC at $3.47M, and BingX at $2.87M.
LAB Forecast 2026: Chart Analysis
Pair: LAB/USDT | Exchange: KuCoin | Timeframe: 1H | As of: July 25, 2026, 12:42 UTC+5:30
LAB moved through a clean falling channel from July 17 to July 21, tracking lower highs and lower lows between two descending trendlines, dropping from around $0.22 toward the $0.11266 area.
On July 21-22, the price broke out of that channel to the upside on a strong impulsive candle, then built a short-term ascending structure with a rising trendline through July 22-25.
Unlike the previous rejection, this rising trendline is still holding. Price has been consolidating between roughly $0.1484 and $0.17554 for the past few days, with the ascending trendline acting as dynamic support underneath that range and the current price at $0.15304 sitting just below the EMA 20/50 cluster.
The EMA readings (20: 0.15546, 50: 0.15434, 100: 0.16024, 200: 0.39622) show the 20 and 50 EMA converging tightly around $0.1543 to $0.1555, just above the current price, acting as the immediate resistance to clear for continuation.
The 100 EMA at $0.16024 sits just above that, adding a second layer of resistance before the $0.17554 zone, while the 200 EMA remains far overhead near $0.39622 and is not near-term relevant.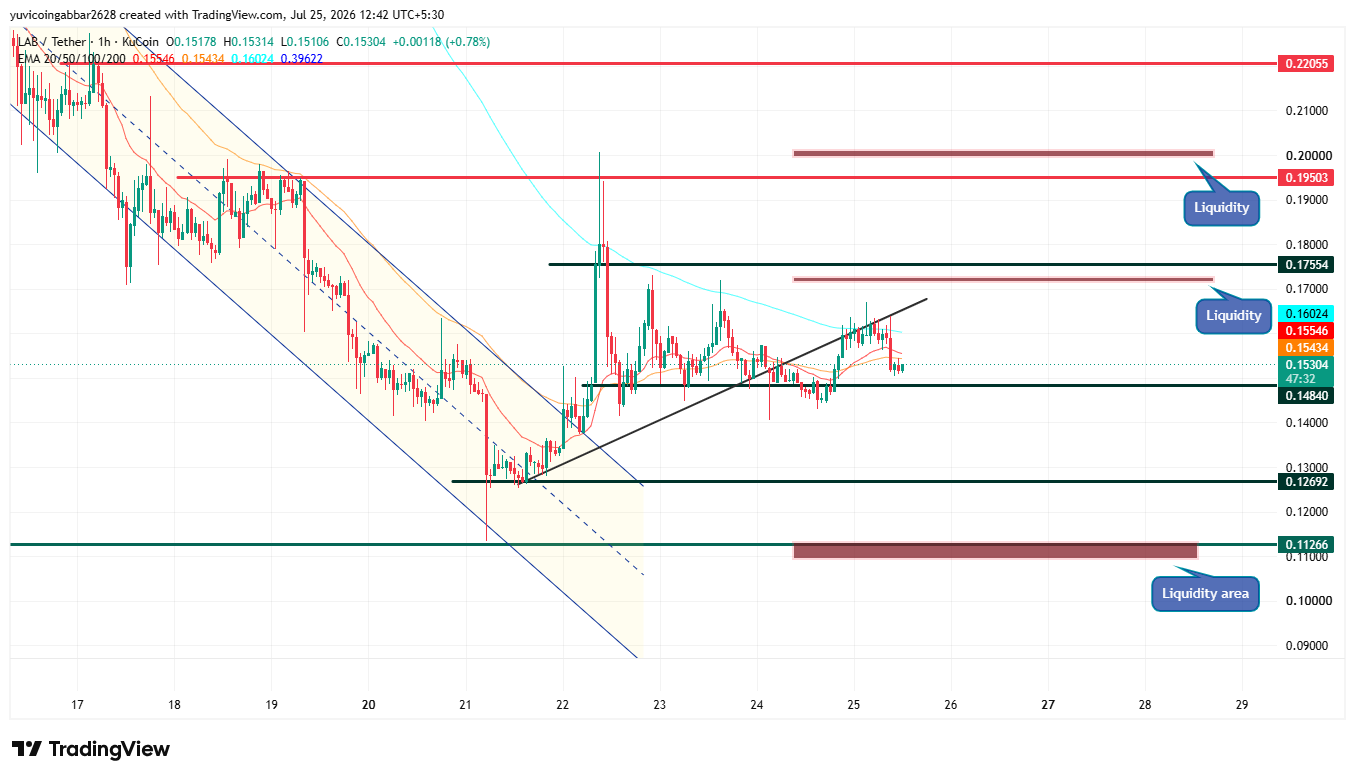
Level | Price | Type |
Upper liquidity / resistance | $0.19503 | Untested resistance, well above current structure |
Immediate resistance | $0.17554 | First resistance, channel breakout high area |
100 EMA resistance | $0.16024 | Second resistance layer above the EMA cluster |
EMA 20/50 cluster | $0.1543 - $0.1555 | Immediate resistance, needs to clear for continuation |
Immediate price reference | $0.15304 | Current price, just below the EMA cluster |
Rising trendline support | ~$0.148 - $0.150 (rising) | Dynamic support from the ascending structure since July 22, still holding |
First support | $0.14840 | Recent consolidation floor |
Deeper support | $0.12692 | Prior channel low |
Liquidity area | $0.11266 | Origin of the channel breakout |
Far resistance | $0.22055 | Longer-term liquidity level, not near-term relevant |
LAB Price Prediction: Price Scenarios
Scenario | Target | Probability | Trigger | Confirmation Level | Time frame | Invalidation Level |
Bullish | $0.17554 | 30% | Reclaim of $0.1535 EMA crossover zone on rising volume | Daily close above $0.1535 with volume above the 7-day average | 3 to 7 days | Close back below $0.12692 |
Base Case | $0.12692 to $0.1535 | 50% | Price stays range-bound with no clear volume expansion or whale movement | Price holding inside the range for 3 or more consecutive days | 3 to 7 days | Daily close outside either side of the range |
Bearish | $0.11266 | 20% | Break below $0.12692 support, continued long liquidations, or a large wallet moving funds to an exchange | Daily close below $0.12692 on rising volume | 3 to 7 days | Reclaim of $0.12692 on rising volume |
Probability weighting reflects that LAB has held its post-breakout range for several days without a decisive move, favoring the base case, while the extreme whale concentration adds asymmetric downside risk that keeps the bearish case above a token-level baseline.
Can LAB reach $0.17554?
A move to $0.17554 is achievable within the current base case structure, but it depends on LAB first reclaiming and holding the $0.15304 EMA crossover zone on volume meaningfully above the recent average. Given the top 5 wallets control 72.85% of the supply, a sustained rally would likely need either continued retail-driven volume or at least no large holder selling into the move.
What Could Invalidate the Bullish Setup?
The bullish case would be invalidated by a daily close back below $0.12692, particularly if it coincides with a spike in long liquidations or unusual outflow activity from one of the top-ranked wallets identified on BscScan.
Given how concentrated ownership is, a single large wallet moving supply toward an exchange would be a more immediate red flag than typical retail-driven selling.
Two Scenarios: Bounce vs Breakdown
Bounce scenario: If LAB reclaims the $0.1535 EMA crossover zone on rising volume, the next test becomes $0.17554, the first confirmed resistance from the recent channel breakout high. Invalidation for this view is a daily close back below $0.12692.
Breakdown scenario: If price fails to hold above $0.12692 and long liquidations continue, LAB risks sliding toward the deeper $0.11266 liquidity zone, which marks the origin of the earlier channel breakout. Invalidation for this view is a reclaim of $0.12692 on rising volume.
Risks Traders Should Watch
LAB has seen the bulk of its recent liquidations come from long positions, meaning leveraged buyers have repeatedly been stopped out on pullbacks.
Beyond the chart, the on-chain concentration data is the bigger structural risk here: a Gini score of 0.9994 and a single wallet holding 20% of the supply mean the price can move sharply on decisions made by very few holders, independent of retail sentiment or technical levels.
Treat any bounce attempt with caution until it clears the $0.1535 EMA crossover zone on real volume, and keep an eye on large wallet activity alongside the chart.
LAB Market Outlook: Expert View
According to CoinGabbar analyst, the chart structure and liquidation data tell a fairly balanced short-term story, but the on-chain holder data changes the risk picture.
The short-term uptrend that formed after the falling channel breakout failed right at the EMA crossover, and longs have absorbed most of the recent liquidation pain.
At the same time, a token where 17 wallets each hold over 1% of supply carries a structural risk that no chart pattern can fully price in.
Watching whether LAB can reclaim $0.1535 on rising spot volume, without any signs of large wallet distribution, will say more about a genuine reversal than the MoonPay news or the chart alone.
Disclaimer: This article is for informational purposes only and should not be considered financial or investment advice. Cryptocurrency markets are highly volatile, and prices can change rapidly based on market conditions. Readers should conduct their own research and consult a qualified financial advisor before making any investment decisions. CoinGabbar does not guarantee the accuracy of price predictions, and past performance is not indicative of future results.

















