LAB Price Prediction: Bulls Return, Channel Break, $LAB Rally or Trap?


LAB is showing real signs of life after last week's brutal crash, and the chart is finally giving bulls something to work with.
$LAB positions itself as an AI-powered ecosystem project, according to the project's own materials.
This LAB Price Prediction looks at whether this bounce has real legs or whether it's simply a relief move after an oversold drop. Stick around till the end to see what the charts are hinting at next.
LAB Price Prediction Market Overview
Metric | Value |
Current Price | $0.18299 |
7 Day Change | -19.6% |
24h Range | $0.1253 - $0.1982 |
Market Cap | $59.869M |
Fully Diluted Valuation | $185.615M |
24h Trading Volume | $33.514M |
Circulating Supply | 322.543M $LAB |
Total / Max Supply | 1B $LAB |
Source: Data from CoinGecko as of 22/07/2026. Figures may vary slightly across other tracking websites.
Why Is LAB Bouncing Back Right Now
LAB's own team has been running a staking push, telling holders the reward pool for stakers is limited and that more LAB is being committed to it every day, with messaging built around urgency to lock in rewards early. 
This is official project marketing rather than independent news, so it should be read as promotional context rather than a reason for the price move itself.
LAB Price Chart Analysis Short Term
LAB spent several days trading in a slide down a clean descending channel from July 15 through July 21.
The price bottomed down and then broke out sharply to the upside, clearing the selling range of $0.14974 and continuing higher, up on the most recent candle.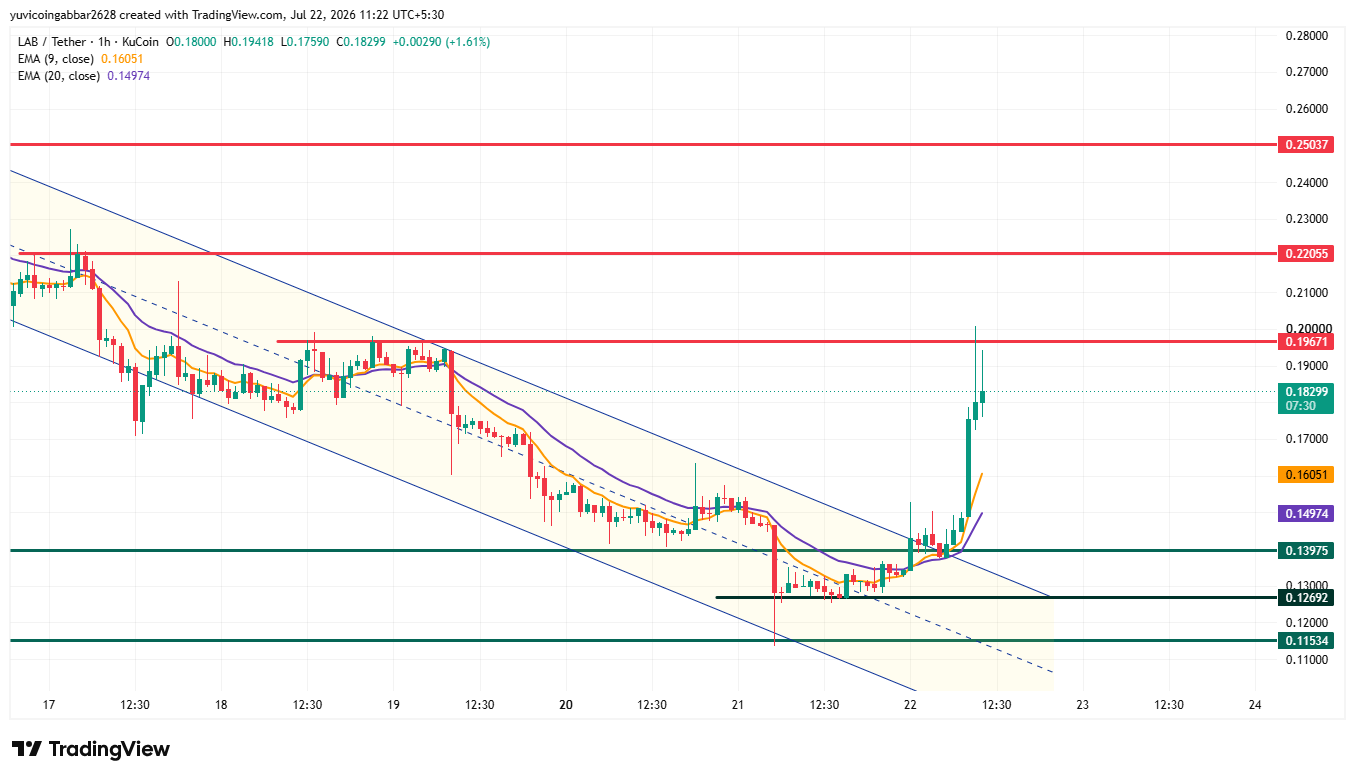
EMA 9 is at 0.16051 and EMA 20 is at 0.14974, with a bullish EMA crossover between the 9 & 20 EMAs; the price is now trading well above both, a clear short-term bullish shift after the channel breakout.
LAB Short-term chart important levels
Level Type | Price |
Resistance | $0.25037 |
Resistance (closer) | $0.22055 |
Resistance (near-term) | $0.19671 |
Immediate price reference | $0.18299 |
First confirmed support | $0.13975 |
Deeper support | $0.12692 |
Deeper support (lower) | $0.11534 |
LAB Price Forecast Long-Term Chart Analysis
The daily chart shows the full extent of LAB’s recent selloff.
$LAB crashed hard from a high near $0.45 down through a steep multi-day decline, sliding all the way to the $0.1140 to $0.1539 zone.
Right at the bottom of that slide, Price created a hammer candle, a candle with a small body near the top and a long lower wick, showing sellers pushed price down sharply during the session, but buyers stepped in hard enough to drag it back up before the candle closed.
A hammer candle after a steep decline is generally read as a possible reversal signal; it shows the selling pressure met real resistance at that level rather than continuing unchallenged.
Price has since followed through with a green candle, up 40% on the day, adding some weight to that reversal read, though one candle and one follow-through session are not yet enough to call the downtrend fully over.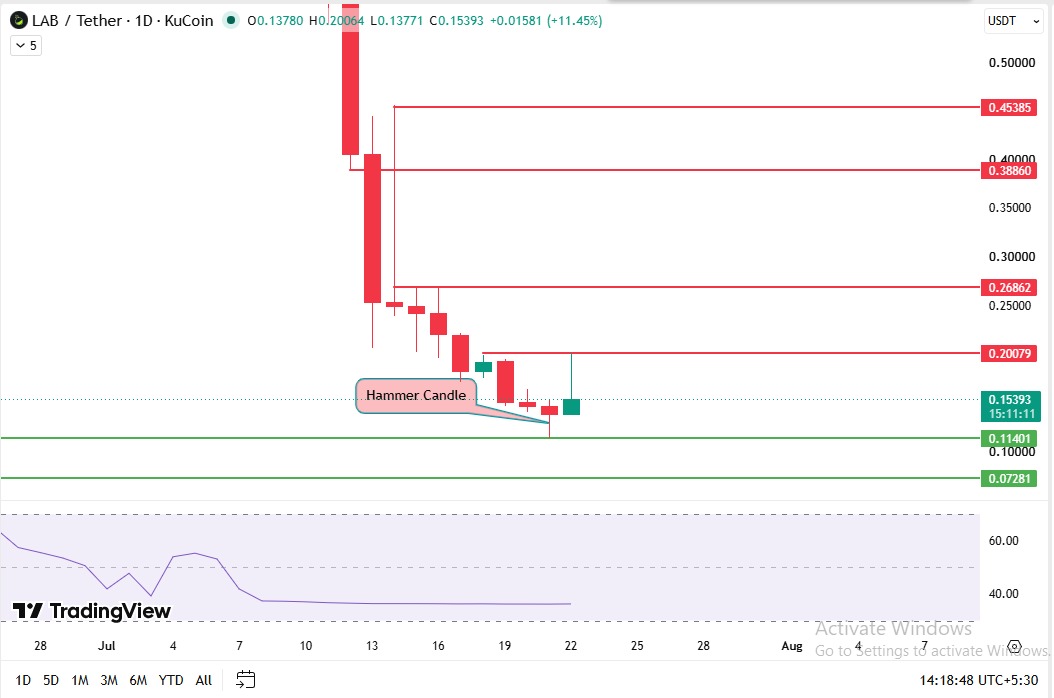
Level Type | Price |
Resistance | $0.45385 |
Resistance (closer) | $0.38860 |
Resistance (near-term) | $0.26862 |
Resistance (closer still) | $0.20079 |
First confirmed support (hammer low) | $0.11401 |
Deeper support | $0.07281 |
Verdict: The hammer candle at $0.11401 marks the level that needs to hold for this reversal read to stay valid. A break back below that would undo the bullish signal the hammer gave.
Two Reader Takeaways
For existing holders, the level to watch is the first 4-hour support at $0.13975. Holding above that keeps the bounce structure intact.
For anyone considering an entry, the trader debate over whether this is a real bottom or just a scrape is worth taking seriously. Waiting for a confirmed hold above $0.19671 offers a cleaner signal than chasing the bounce mid-move.
LAB Market Outlook Expert View
According to CoinGabbar analysts, this setup calls for genuine caution despite the strength of the bounce.
The bull case rests on $LAB holding above $0.13975 and eventually clearing $0.11401 to challenge the bigger downtrend.
The bear case shows up if the price loses $0.13975 again, which would support the idea that this is simply a bounce along the bottom rather than a real reversal.
Given how sharp both the crash and the recovery have been, this looks more like an oversold snapback than a confirmed trend change for now.
Disclaimer: This article is for informational purposes only and should not be treated as financial advice. Cryptocurrency markets are highly volatile and carry significant risk.
Also read:

















