MemeCore Price Prediction: Is MEME About to Explode Higher?


MemeCore price prediction searches have spiked lately, and it's not hard to see why.
This coin went from a near-vertical crash to one of the sharpest recoveries in the meme sector, and now it's boxed inside a triangle that's been tightening for weeks.
MEME's fate from here leans heavily on how Bitcoin and Ethereum trade too, since a risk-on market tends to lift smaller alts like this one right along with it.
Let's break down what the charts are actually telling us.
Where Is MemeCore Trading Right Now?
MEME is currently trading around $1.26, sitting almost dead-center inside a shrinking range that both the daily and 4-hour charts agree on.
Neither timeframe has picked a side yet, but the walls are closing in fast, which usually means a breakout isn't too far away.
MemeCore Liquidation Data: Who's Getting Rekt Right Now?
The liquidation numbers tell an interesting story here.
Over the last 24 hours, $10.12K in MEME positions got wiped out, with longs taking the bigger hit at $8.06K against just $2.06K in shorts. 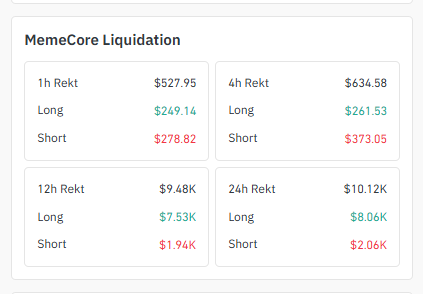
Source: Data Taken From Coinglass.
The 12-hour window shows the same lean, $7.53K in longs liquidated versus only $1.94K in shorts, so the broader trend has been longs getting caught on the wrong side.
Zoom into the shorter windows, and the picture flips a little. In the last 4 hours, shorts actually took slightly more damage at $373.05 compared to $261.53 in longs, and it's a similar story over the last hour too.
That flip suggests MEME found a short-term bounce that squeezed short-sellers, even while the bigger 12-24 hour trend still favors long liquidations.
MemeCore Exchange Volume: Where Is the Action Happening?
BingX leads MEME futures volume by a wide margin at $6.65M, followed by Binance at $3.28M and KuCoin at $2.73M. Bybit, LBank, Gate, and Bitget round out the rest of the volume, though at noticeably smaller sizes. 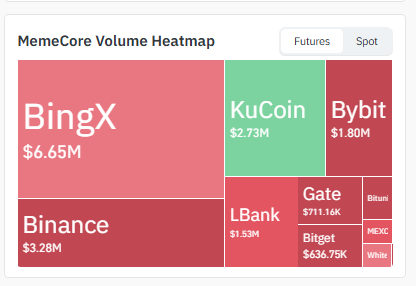
Source: Heatmap Data Taken From Coinglass.
With BingX commanding such a large share, sudden moves there can end up setting the tone for the rest of the market.
MemeCore 4H Chart: Symmetrical Triangle Tightens Further
Switch to the 4-hour chart, and the squeeze looks even tighter.
MEME is coiling between resistance at $1.5015 and support at $1.1532, with the triangle's apex getting closer by the hour. 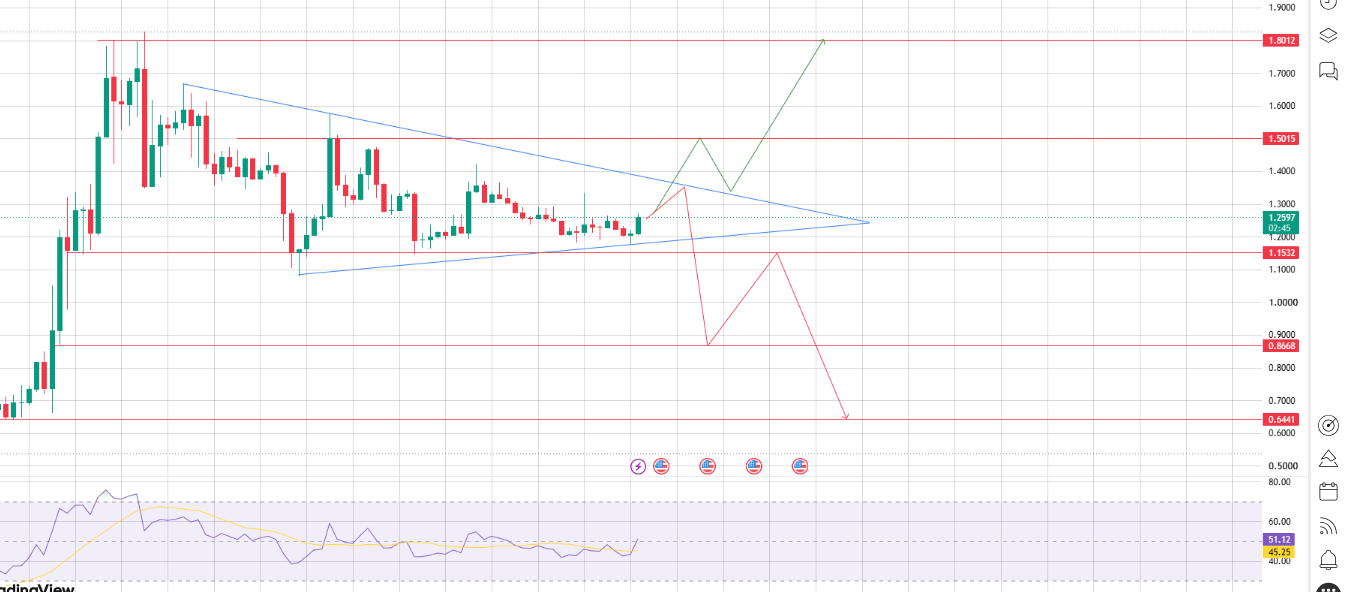
Source: Chart Taken From TradingView
RSI here sits just around 51, a touch more balanced than the daily but still not committing to a direction.
Key levels worth watching:
-
Resistance: $1.5015 first, then $1.8012
-
Support: $1.1532, with $0.8668 and $0.6441 as deeper cushions if the floor gives way
A clean break above $1.5015 would likely trigger a fast move toward $1.8012. Lose $1.1532, though, and MEME could slide toward $0.8668 before any real bounce shows up.
MemeCore 1D Chart: Triangle Squeeze Nears a Decision
The daily chart shows MEME recovering hard off its lows, only to run into a wall and start compressing into a symmetrical triangle.
Resistance sits at $1.8277, while support down near $1.1916 has held firm through several tests. Below that, $0.7254 is the next real floor if things really fall apart.
RSI is sitting at 39, which isn't oversold but isn't bullish either; it's basically neutral, mirroring the indecision on the price chart itself.
A confirmed breakout above $1.8277 opens the door toward $2.6633, a level that would mark a serious reclaim of MEME's earlier highs.
MemeCore Price Prediction: Three Scenarios to Watch
| Scenario | Trigger | Price Target |
|---|---|---|
| Bullish | Breaks and holds above $1.5015 | $1.8012, then $2.6633 |
| Neutral/Range | Stays between $1.1532 and $1.5015 | Sideways chop, no clear trend |
| Bearish | Loses $1.1532 support | $0.8668, then $0.6441 |
What's Next for MemeCore? Final Price Outlook
Both timeframes are pointing at the same thing: MEME is compressed and waiting on a trigger.
A break above $1.5015 on the 4H, confirmed by a daily close over $1.8277, would put the $2.6633 target back in play.
On the flip side, losing $1.1532 support opens up a slide toward $0.8668 and eventually $0.6441.
Worth remembering too, MEME's price action doesn't happen in a vacuum.
If Bitcoin and Ethereum keep grinding higher, that kind of market-wide confidence tends to filter down into names like MemeCoin fast and could be exactly what tips this triangle toward the upside.
A weaker BTC/ETH market, on the other hand, would likely pull that support away just as quickly.
Disclaimer: This article is for informational purposes only and should not be considered financial advice. Cryptocurrency markets are volatile; please do your own research before making any investment decisions.

















