Midnight Price Prediction: Is The Hidden Recovery Loading?

Midnight is trading at $0.019832, and this chart is telling a story that started with a violent crash and is now shaping into something worth watching closely.
The token is down nearly 26% on the day and had shed close to 45% at one point before clawing part of it back.
This kind of move followed by a tightening structure doesn't show up often, and when it does, it usually means one thing for the next few sessions.
This midnight price prediction breaks down what triggered the crash, where the key levels sit, and what would flip this recovery attempt invalid.
Midnight Price Right Now
Metric | Value |
Price | $0.019832 |
24h Change | -25.76% (-$0.006759) |
Market Cap | $325.49M |
Futures Volume (24h) | $225.04M |
Spot Volume (24h) | $81.35M |
Open Interest | $20.97M |
Circulating Supply | 16.60B $NIGHT |
Total Supply | 24.00B $NIGHT |
Max Supply | 24.00B $NIGHT |
Source: CoinGlass, as of July 21, 2026, Figures may vary slightly across other tracking websites
Why Is the Midnight Price Down Today?
According to the Wu Blockchain X account. Midnight isn't dropping in a vacuum, so it helps to know exactly what happened.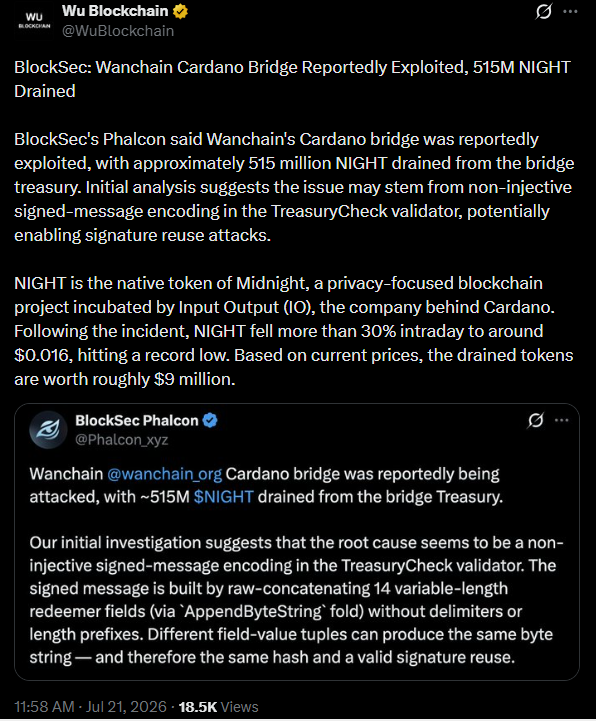
Reports surfaced that a bridge connected to the Cardano ecosystem was reportedly exploited, with roughly 515 million $NIGHT drained from a bridge treasury.
Security researchers who flagged the incident pointed to a technical flaw in how signed messages were being validated, one that potentially allowed the same signature to be reused in a way it shouldn't have been.
Midnight is the native token of a privacy-focused blockchain project incubated by Input Output, the same company behind Cardano.
Following the incident, Midnight fell more than 30% intraday, hitting a record low around $0.016. Based on prices at the time, the drained tokens were worth roughly $9 million.
That mismatch between a security scare and price trying to stabilize afterward is what makes $NIGHT current chart worth paying attention to.
NIGHT Liquidation Data Today (21 July 2026)
According to CoinGlass, midnight liquidations have leaned toward longs on the full-day window and toward shorts as the timeframe narrows.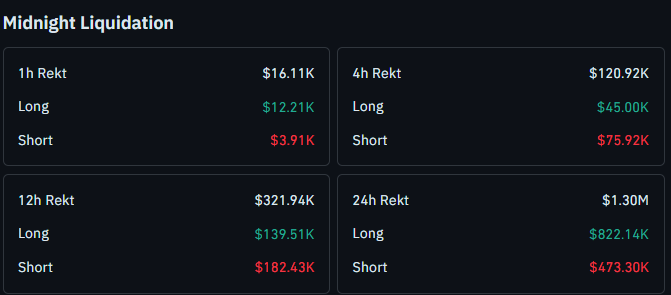
Over the past hour, $16.11K was liquidated, with $12.21K from longs and $3.91K from shorts.
The 4-hour window shows $120.92K in total liquidations, with $45.00K from longs and $75.92K from shorts.
Over 12 hours, that climbs to $321.94K, made up of $139.51K in longs and $182.43K in shorts.
Across the full 24 hours, liquidations total $1.30M, with longs accounting for $822.14K and shorts for $473.30K.
The larger share of long liquidations over the full day lines up with the initial crash, while the more recent short liquidations on the shorter timeframes support the idea that sellers got caught off guard once Midnight stopped falling and started to bounce.
Midnight Price Prediction: Chart Analysis (Short-Term Outlook)
Methodology note: This reading uses the 1-hour Midnight/USDT chart on OKX via TradingView, combining price structure with RSI for momentum confirmation. Levels are invalidated only on a confirmed candle close beyond the stated trigger, not an intraday wick.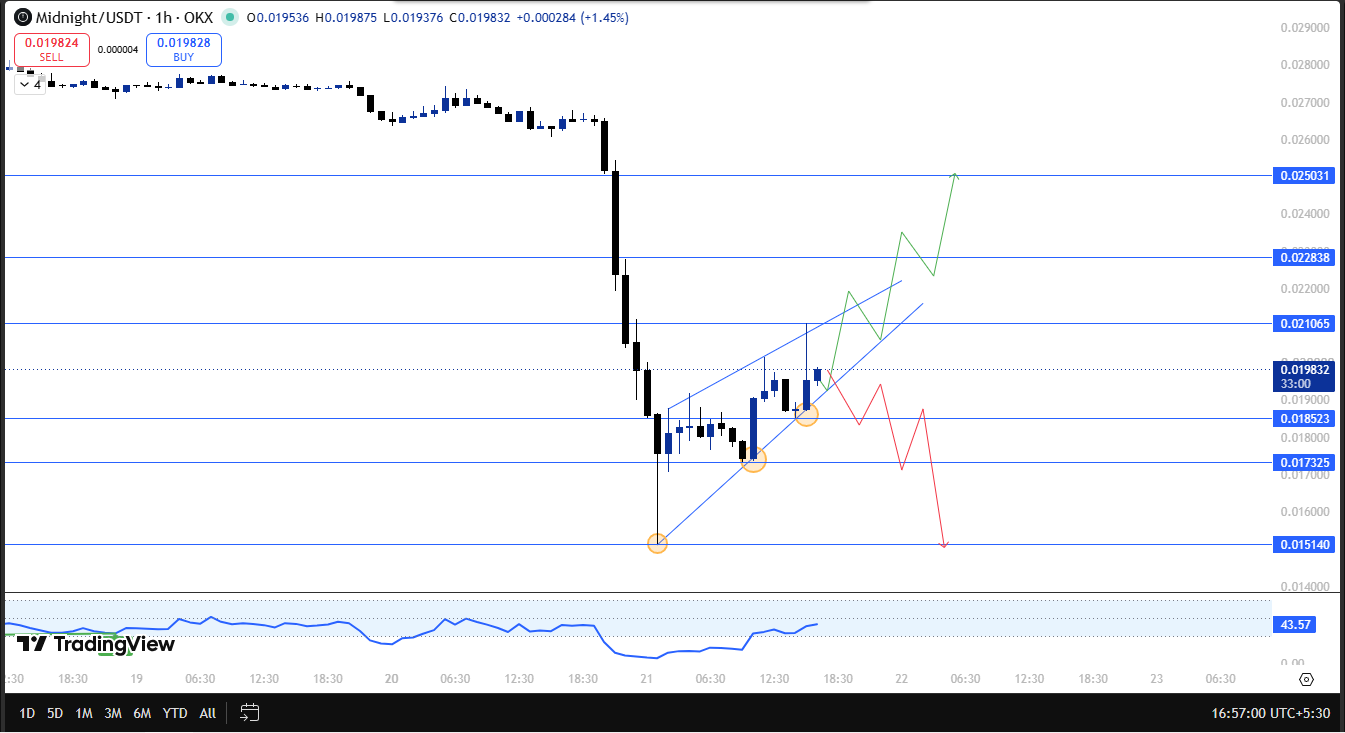
After the sharp drop, price found its footing and has been carving out a rising wedge on the 1-hour chart, a structure built from three clear touchpoints: the first at the bottom of the move, a higher low after that, and a third touch as the wedge tightens further.
This is exactly the kind of coiling structure that usually resolves with a decisive move in one direction once it runs out of room.
Right now, the price is trading at $0.019832 inside this wedge. Every level below the current price is acting as support, and everything above is resistance the wedge would need to clear.
On the downside, the first support to watch is $0.018523, followed by $0.017325, and if the recovery attempt completely fails, $0.015140 comes back into play, not far from the record low tagged during the crash.
On the upside, if price manages to break out of this wedge and hold, the first resistance sits at $0.021065, with further targets at $0.022838 and then $0.025031 if momentum really picks up.
On the momentum side, RSI is currently reading 43.57, sitting in fairly neutral territory, which fits with the idea that this wedge is still undecided rather than clearly leaning one way.
A confirmed close outside either boundary of the wedge is what would actually tip the scales here.
Midnight Technical Snapshot
Indicator | Signal |
Trend | Rising wedge, undecided |
RSI | 43.57, neutral |
Structure | Post-crash rising wedge on 1h chart |
Liquidations | Shorts getting squeezed on shorter timeframes |
Catalyst |
$Midnight Support and Resistance Levels
Type | Level | Note |
Resistance 3 | $0.025031 | Extended upside target |
Resistance 2 | $0.022838 | Mid-target on breakout |
Resistance 1 | $0.021065 | Immediate wedge resistance |
Current Price | $0.019832 | Trading inside the rising wedge |
Support 1 | $0.018523 | First support below current price |
Support 2 | $0.017325 | Invalidation trigger on a confirmed close below |
Support 3 | $0.015140 | Near the recent record low |
Risk-Reward Table
Case | Trigger | Target |
Bull Case | Wedge breakout holds above $0.021065 | Move toward $0.022838 and $0.025031 |
Bear Case | Confirmed close below $0.018523 | Slide toward $0.017325 and $0.015140 |
Invalidation Level
For this recovery attempt on Midnight to keep working, the price needs to hold above $0.018523 inside the wedge.
If Midnight closes below $0.018523 on the 1-hour chart, that breaks the setup, and $0.017325 followed by $0.015140 comes into focus on the downside.
Historical Context
What makes this move worth tracking is how fast Midnight went from a record low to building an organized structure. Every prior candle right after the exploit news was pure panic selling with no real support forming.
This time, price found three separate points where buyers stepped in at higher levels each time, and that alone tells you something may have shifted from panic to accumulation.
Midnight Glossary
Rising Wedge: A pattern formed by two converging upward sloping trendlines, often signaling a breakout or breakdown once price runs out of room.
RSI (Relative Strength Index): A simple indicator that shows whether an asset has been moving too fast in one direction, helping traders spot when something might be overbought or oversold.
Open Interest: The total value of derivative positions like futures that are still open and haven't been closed out yet.
Liquidation: What happens when a leveraged trade gets forcibly closed because the trader ran out of margin to keep it open.
Bridge Exploit: A security breach where an attacker manipulates a cross-chain bridge's validation logic to drain funds from a treasury or pool.
Expert View
As per Coingabbar market analyst, Midnight's rising wedge forming right after a bridge exploit-driven crash means more this time than a routine consolidation would, simply because of how violent the initial move was.
The fact that price found three separate points where buyers stepped in, each one higher than the last, suggests panic selling has given way to more organized positioning.
Add in the fact that short sellers have been getting squeezed on the shorter timeframes, and the short-term picture leans toward a possible push up to $0.021065 and potentially $0.022838 as long as the wedge holds.
If Midnight ends up closing below $0.018523, though, that would be the clearest sign this recovery attempt didn't work out, and $0.015140 would be back on the table.
Disclaimer: This article is for informational purposes only and should not be considered financial advice. Cryptocurrency markets are highly volatile, and price predictions are not guaranteed. Please do your own research before making any investment decisions.
2 months ago
FROM CRAB FISHERMAN TO $64 MILLION LOTTO WINNER WITH LORD BUBUZA SPELL: I have been a crab fisherman for 40 years. I started working at a local fish plant a few years ago. I love playing lotto bets, so I buy lotto tickets often but find it difficult to win. I read about Lord Bubuza's lottery spells on the internet, so I contacted him for help to win Lotto 649. He told me that he would need to cast a lotto spell so that he can reveal the lotto numbers I will choose. I was sceptical, but my wife Nancy told me to give it a try. I provided his requirements to cast the lotto spells, and he gave me the numbers. I bought a Lotto 649 ticket and played as Lord Bubuza instructed, to my surprise it was a big win. I won $64,000,000. My partner Nancy and I travelled to the Atlantic Lottery in Moncton to confirm the win and collect the prize. I will retire from my crab fishing with this win and continue to recommend lord Bubuza. Join me and appreciate Lord Bubuza for his help via Email: lordbubuzamiraclework@hotmail.com or WhatsApp: +1 (365) 808 5313

2 months ago
FROM CRAB FISHERMAN TO $64 MILLION LOTTO WINNER WITH LORD BUBUZA SPELL: I have been a crab fisherman for 40 years. I started working at a local fish plant a few years ago. I love playing lotto bets, so I buy lotto tickets often but find it difficult to win. I read about Lord Bubuza's lottery spells on the internet, so I contacted him for help to win Lotto 649. He told me that he would need to cast a lotto spell so that he can reveal the lotto numbers I will choose. I was sceptical, but my wife Nancy told me to give it a try. I provided his requirements to cast the lotto spells, and he gave me the numbers. I bought a Lotto 649 ticket and played as Lord Bubuza instructed, to my surprise it was a big win. I won $64,000,000. My partner Nancy and I travelled to the Atlantic Lottery in Moncton to confirm the win and collect the prize. I will retire from my crab fishing with this win and continue to recommend lord Bubuza. Join me and appreciate Lord Bubuza for his help via Email: lordbubuzamiraclework@hotmail.com or WhatsApp: +1 (365) 808 5313
2 months ago
FROM CRAB FISHERMAN TO $64 MILLION LOTTO WINNER WITH LORD BUBUZA SPELL: I have been a crab fisherman for 40 years. I started working at a local fish plant a few years ago. I love playing lotto bets, so I buy lotto tickets often but find it difficult to win. I read about Lord Bubuza's lottery spells on the internet, so I contacted him for help to win Lotto 649. He told me that he would need to cast a lotto spell so that he can reveal the lotto numbers I will choose. I was sceptical, but my wife Nancy told me to give it a try. I provided his requirements to cast the lotto spells, and he gave me the numbers. I bought a Lotto 649 ticket and played as Lord Bubuza instructed, to my surprise it was a big win. I won $64,000,000. My partner Nancy and I travelled to the Atlantic Lottery in Moncton to confirm the win and collect the prize. I will retire from my crab fishing with this win and continue to recommend lord Bubuza. Join me and appreciate Lord Bubuza for his help via Email: lordbubuzamiraclework@hotmail.com or WhatsApp: +1 (365) 808 5313
2 months ago
FROM CRAB FISHERMAN TO $64 MILLION LOTTO WINNER WITH LORD BUBUZA SPELL: I have been a crab fisherman for 40 years. I started working at a local fish plant a few years ago. I love playing lotto bets, so I buy lotto tickets often but find it difficult to win. I read about Lord Bubuza's lottery spells on the internet, so I contacted him for help to win Lotto 649. He told me that he would need to cast a lotto spell so that he can reveal the lotto numbers I will choose. I was sceptical, but my wife Nancy told me to give it a try. I provided his requirements to cast the lotto spells, and he gave me the numbers. I bought a Lotto 649 ticket and played as Lord Bubuza instructed, to my surprise it was a big win. I won $64,000,000. My partner Nancy and I travelled to the Atlantic Lottery in Moncton to confirm the win and collect the prize. I will retire from my crab fishing with this win and continue to recommend lord Bubuza. Join me and appreciate Lord Bubuza for his help via Email: lordbubuzamiraclework@hotmail.com or WhatsApp: +1 (365) 808 5313
2 months ago
FROM CRAB FISHERMAN TO $64 MILLION LOTTO WINNER WITH LORD BUBUZA SPELL: I have been a crab fisherman for 40 years. I started working at a local fish plant a few years ago. I love playing lotto bets, so I buy lotto tickets often but find it difficult to win. I read about Lord Bubuza's lottery spells on the internet, so I contacted him for help to win Lotto 649. He told me that he would need to cast a lotto spell so that he can reveal the lotto numbers I will choose. I was sceptical, but my wife Nancy told me to give it a try. I provided his requirements to cast the lotto spells, and he gave me the numbers. I bought a Lotto 649 ticket and played as Lord Bubuza instructed, to my surprise it was a big win. I won $64,000,000. My partner Nancy and I travelled to the Atlantic Lottery in Moncton to confirm the win and collect the prize. I will retire from my crab fishing with this win and continue to recommend lord Bubuza. Join me and appreciate Lord Bubuza for his help via Email: lordbubuzamiraclework@hotmail.com or WhatsApp: +1 (365) 808 5313
2 months ago
Hello everyone, greetings from Miss Shanghai Carlo, i was a victim of online scam, got registered on a trading website which turns out to be scam, they call their brand FX pro trader, i work for a popular organization and i handle the payroll, after losing all my funds to scammer, they hacked into my Email and divert all payment to unknown account which were only able to decode by Alien Wizbot hack service tools, during the recovering process the scammers phone were hacked in other to get them arrested, don't just recover your funds but also get them arrested, this differentiate the real hacker from impersonator's. today i am happy to write here and to inform you all that I regained my work position and all funds recovered, lastly, the thieves are serving in prison now, God bless America. reach alienwizbot(@)gmail(.)com for help or Whatsapp +16262645164
2 months ago
After investing a huge portion of my savings about $850,000 USD to fake investment scheme, I soon realized I had been scammed when they refused to let me withdraw any of my funds. At first, I was skeptical about recovering lost Bitcoin, until a friend introduced me to this recovery company and as I speak to you all my funds has been recovered back to me within 24 hours. If you’ve lost money in a crypto scam, don’t give up . Contact them on: recoverydarek@gmail.com they helped me recovered my scammed crypto back to me, they can also be of help to other victims.
2 months ago
I have had my own share of binary option scam, I lost over 22k USD, and i was still told to send more money to unlock my account. I reached out to recoverydarek@gmail.com and they helped me get my money back. If you have ever been scammed or you know someone that has been scammed, recoverydarek@gmail.com will get the money back. They are a recovery team that specialize in ful nds recovery, be it cryptocurrency , bitcoin, forex, catfish/romance scam. They are very real.

















