NEO Price Prediction August 2026: Can NEO Rally to $5 ?


The NEO price prediction August 2026 is picking up fresh interest after a five-time trendline break, leaving the chart looking very different from where it stood just a week ago.
A steady ascending support line that held up for months finally gave way, and now a single candle on the daily chart is doing a lot of the talking about what comes next.
This piece walks through what that candle means, where NEO's real support and resistance sit right now, and what the daily and weekly charts are each saying about August.
NEO Price Today: Live Data and 24-Hour Change
$NEO is changing hands around $1.81, down 0.86% over the past 24 hours.
Market cap stands at $127.74 million against an unlocked market cap and fully diluted valuation of $181.09 million.
Trading volume over the last day came in at $3.63 million, which puts the volume-to-market-cap ratio at 2.77%. Circulating supply is 70.53 million NEO out of a total supply of 100 million, with no max supply set.
Source: NEO data taken from CoinMarketCap, data as of July 31, 2026, 04:02 PM IST.
Quick Take
CMP: $1.816 (-0.49% on the day)
Daily trigger: close above $1.997 opens $2.113, then $2.398 and $2.681
Daily failure: close below $1.703 exposes $1.500, a psychological level
Weekly trigger: close above $2.389 opens $3.410 and then $5.903
Weekly failure: close below $1.500 exposes $1.000, a psychological level
Daily RSI: 33.93 | Weekly RSI: 32.68
Data as of July 31, 2026, 04:02PM IST
NEO Technical Forecast August 2026
$NEO spent months respecting a strong ascending support trendline, bouncing off it close to five separate times.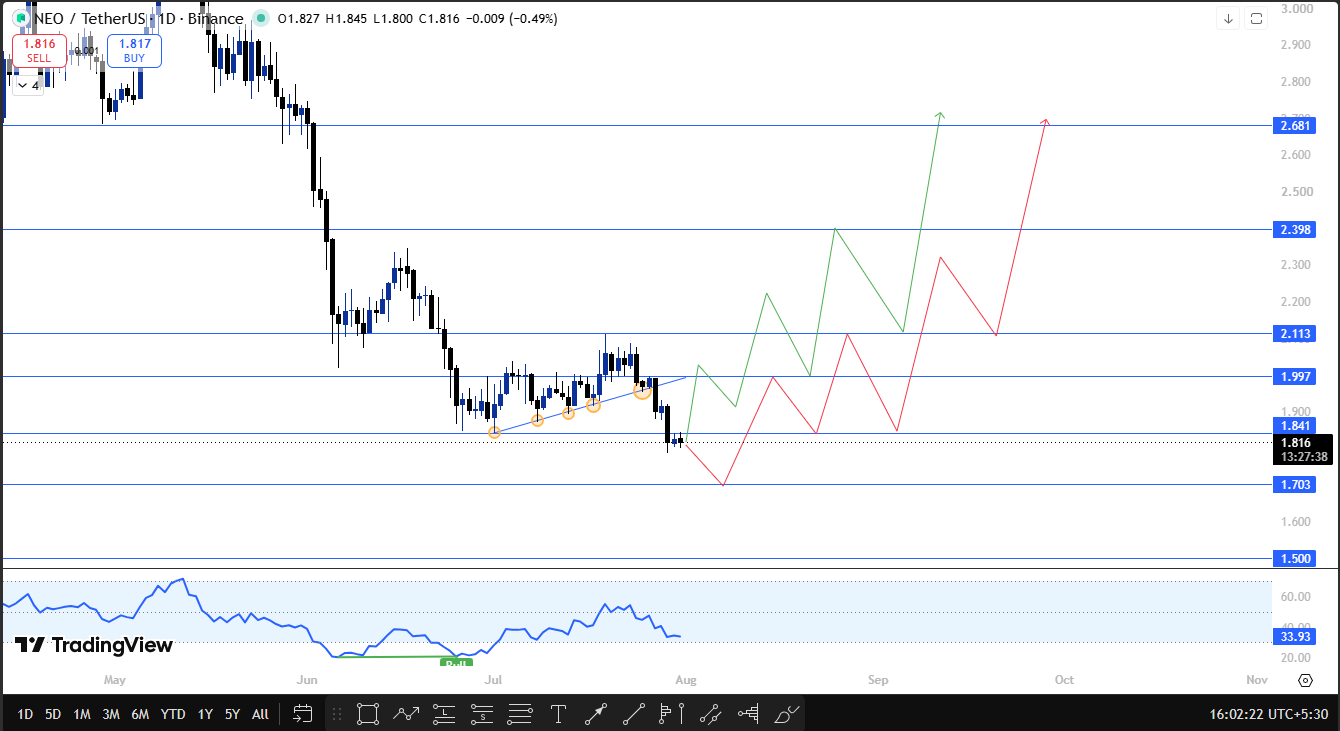
On the fifth touch, that streak finally broke. Sellers pushed through the line with an aggressive closing candle and printed a fresh lower low in the process.
What's caught attention since then is the candle that followed.
Price has formed a doji right after that breakdown and is now trading close to the prior day's closing level, which often signals hesitation between buyers and sellers rather than a clean continuation lower.
Only doji does not confirm reversal, which is when the price breaks and close above 1.997, and the market structure shifts.
Anyone tracking NEO's setup can compare it against the broader price prediction hub for how other coins are behaving in a similar spot.
If $NEO closes a daily candle above $1.997, the next resistance zone opens at $2.113, followed by $2.398 and $2.681.
A close below $1.703 instead would put the $1.500 psychological support back in focus.
Source: NEO daily chart via TradingView, dated July 31, 2026, 16:02 IST.
The weekly chart shows a longer, steadier decline.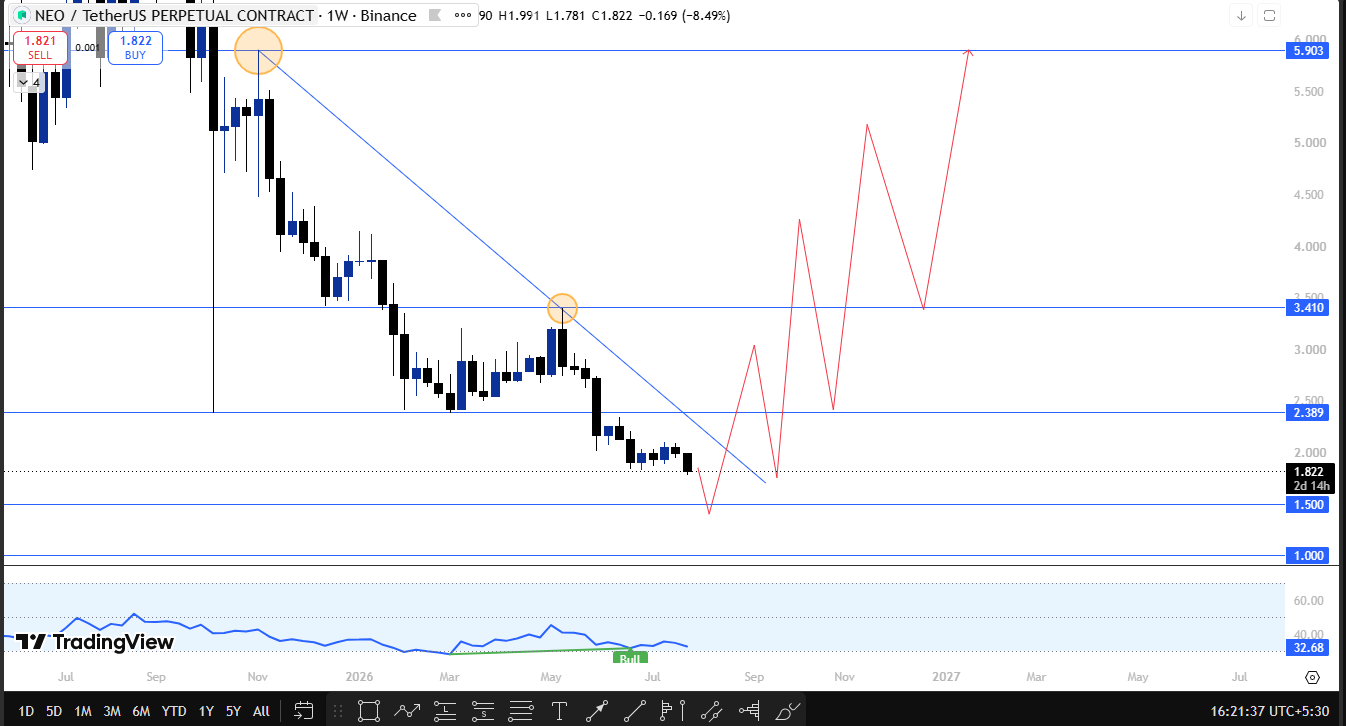
$NEO has been falling along a descending trendline and is currently trading below its last swing low, with $1.500 standing out as the key support zone and a round psychological number traders tend to watch closely.
If that support holds and broader sentiment turns supportive, a weekly close above $2.389 would open the door to $3.410 and then $5.903 further out. If the price instead closes below $1.500, the next support to watch drops to $1.000.
Price resistance is an old swing high and low. But support is psychological because the price is trading at an all-time low.
Source: NEO weekly chart via TradingView, dated July 31, 2026, 16:21 IST.
Technical Analysis: Key Support and Resistance Levels (NEO)
Timeframe | Resistance | Support | Trigger |
Daily | $1.997, $2.113, $2.398, $2.681 | $1.703, $1.500 | Close above/below $1.997 / $1.703 |
Weekly | $2.389, $3.410, $5.903 | $1.500, $1.000 | Close above/below $2.389 / $1.500 |
NEO Price Prediction for August 2026: Bull, Base, and Bear Cases
The base case has NEO working through the aftermath of its trendline break, with the recent doji suggesting a pause rather than a clean move in either direction just yet.
The bull case needs a daily close above $1.997, which opens $2.113 and then $2.398 and $2.681, and builds further if the weekly candle also closes above $2.389 for a run at $3.410 and $5.903.
The bear case activates on a daily close below $1.703 and gets more serious if the weekly candle closes below the $1.500 support, opening the door to $1.000 next.
Each of these depends on a confirmed close on its own timeframe rather than a quick wick through the level.
Technical Outlook (NEO)
Views on NEO right now are fairly divided. One camp is treating the recent doji as an early sign that selling pressure is running out after five straight trendline defenses gave way.
The other camp is more cautious, pointing to the weekly chart still trading below its last swing low as a sign the broader trend hasn't turned yet.
Daily RSI at 33.93 and weekly RSI at 32.68 both sit well under the neutral 50 mark, so momentum on both timeframes still has ground to make up before either side can claim confirmation.
For now, both views are waiting on the same trigger: a decisive close outside the current range.
NEO Long-Term Outlook: 2027 to 2030
If NEO can eventually clear the weekly resistance ladder at $3.410 and $5.903, that would mark a meaningful shift in its longer-term structure.
But getting there starts with the $1.500 weekly support holding first, since a break below it would push the timeline out further.
Anyone tracking NEO's broader roadmap alongside price can also keep an eye on the coin events calendar for anything that might act as a catalyst along the way.
Risks That Could Invalidate This Forecast (NEO)
The bullish read on NEO breaks down if the daily chart fails to close above $1.997 and weakens further if the weekly candle closes below $1.500, which opens the path toward $1.000.
Wider risks include shifts in Bitcoin dominance, changes in overall market liquidity, and general crypto volatility, all of which can override NEO's own chart structure regardless of where its trendlines sit.
Keeping an eye on the latest crypto news can help contextualize any sudden moves outside these technical levels.
How to Buy and Store NEO Safely
NEO can be bought on exchanges that list spot markets for it, ideally ones covered on a reliable exchange listing page before committing funds.
Once purchased, moving NEO to a personal wallet rather than leaving it on an exchange long-term reduces counterparty risk.
A hardware wallet is generally the safer option for larger holdings, and two-factor authentication should be turned on for any exchange account regardless of holding size.
Traders who like to track extra earning opportunities can also check the crypto airdrops page from time to time.
Glossary
Ascending trendline: an upward-sloping line connecting a series of higher lows, used to track a prevailing uptrend
Descending trendline: a downward-sloping line connecting a series of lower highs, used to track a prevailing downtrend
Doji candle: a candle where the open and close are nearly equal, often signaling indecision between buyers and sellers
Swing low: a notable price low formed before a temporary reversal, often used as a structural reference point
RSI (Relative Strength Index): a momentum indicator scaled 0-100, where readings below 50 suggest weaker momentum and above 50 suggest stronger momentum
Support zone: a price band where buying pressure has previously stepped in
Psychological level: a round number that often acts as a support or resistance zone simply because traders watch it closely
Invalidation level: the price point at which a forecast scenario is considered incorrect
Disclaimer: This article is for informational purposes only and does not constitute financial advice. Cryptocurrency markets are highly volatile, and all price levels discussed are based on technical chart analysis, not a guarantee of future performance. Readers should conduct their own research before making any investment decisions.











.jpg)






