Vaulta Price Prediction August 2026: Is $A Ready for a Major Breakout?


Quick thing worth clearing up before diving into this Vaulta Price prediction August 2026, $EOS rebranded to Vaulta back in 2025, with the token itself now trading under the ticker A.
The charts and price data here reflect that Vaulta token, since that's where the actual trading activity and liquidity live now, even though a lot of people still search for this by the old EOS name out of habit.
With that out of the way, the price is sitting at $0.06233, up 3.4% today, and both the daily and weekly charts are showing setups worth paying attention to.
Vaulta Price Today: Live Data and 24-Hour Change
Price is currently trading at $0.06233 right now, up 3.4% over the past day, moving through a range of $0.06057 to $0.06266.
The fully diluted valuation comes in at $131.577M, 24-hour trading volume is a modest $9,875.61, and total value locked sits at $23.881M. 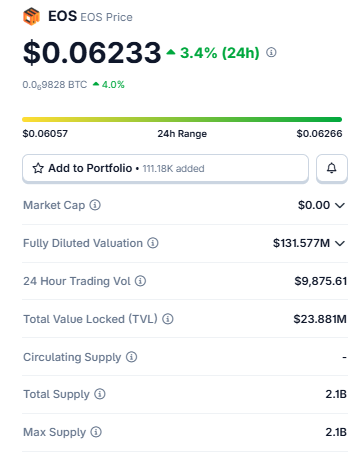
Source: Market Cap Data Taken From Coingecko, data as of July 31, 2026. Figures may vary slightly across other tracking websites.
Total and max supply are both 2.1B tokens.
Market cap and circulating supply aren't showing clean numbers on this particular tracker right now, likely a side effect of the token migration still settling out across different data providers.
So it's worth cross-checking those two figures elsewhere before leaning on them too heavily.
Technical Analysis: Key Support and Resistance Levels (Vaulta)
Vaulta is trading near an important technical zone, where trend direction could soon be decided. The daily chart helps identify the levels that may act as support during pullbacks or resistance during rallies.
Daily Chart: Fibonacci Levels From the Recent Swing
The daily chart shows price inside a narrow descending channel, working through a set of Fibonacci levels drawn from a recent swing high near $0.10001 down to a swing low around $0.05749.
The most recent candle opened at 0.06133, ran up to a high of 0.06315, dipped to 0.06079, and is running at 0.06271.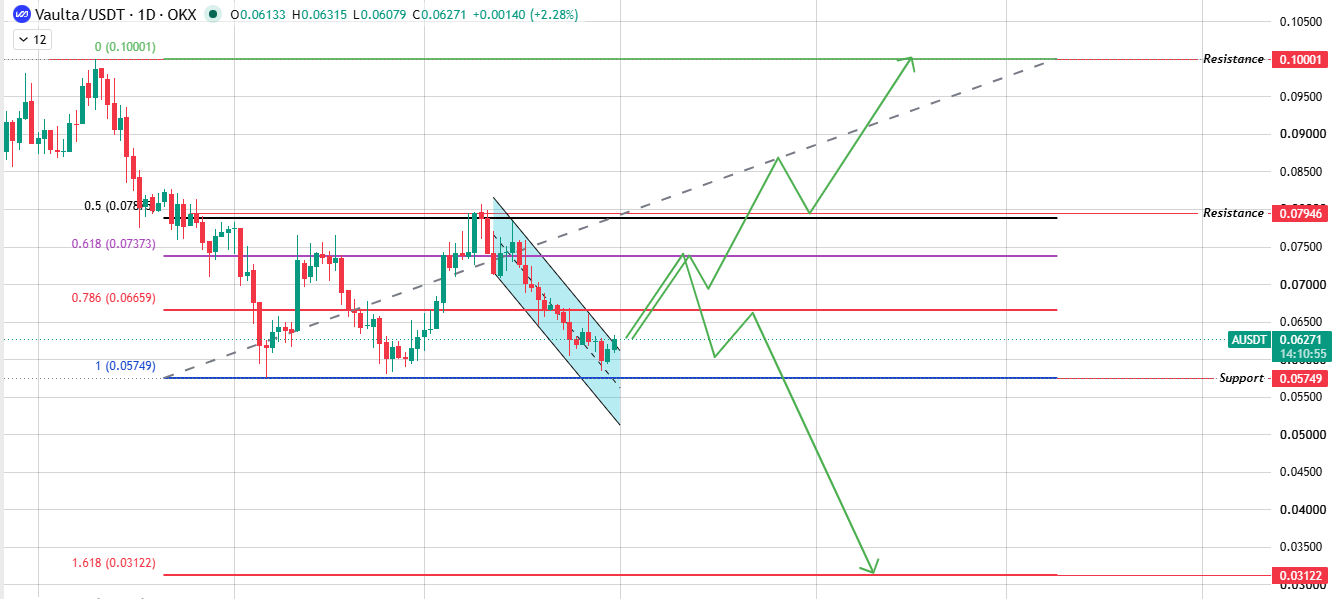
Source: Chart Taken From TradingView.
If the structure breaks with volume, the path opens to the target level first at $0.07946 (0.5 Fib level) with decent volume, and $0.10001 becomes the next real target above it.
If price can't hold current levels and slips back down instead, support sits at $0.05749, with the 1.618 Fibonacci extension near $0.03122 as the deeper downside level if that breaks too.
Weekly Chart: The Bigger Downtrend
Zoom out, and the weekly chart shows the same basic fight playing out on a larger scale.
The latest weekly candle opened at 0.06364, hit a high of 0.06604, dropped to a low of 0.05844, and is running at 0.06249.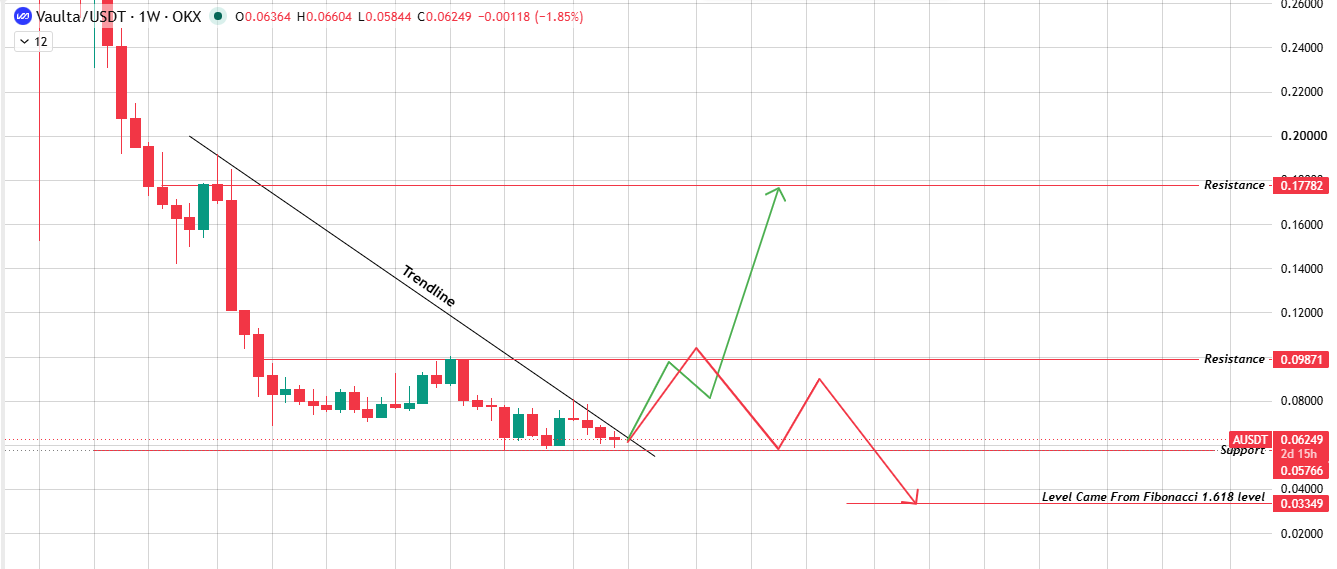
Source: Chart Taken From TradingView.
A long descending trendline has capped every bounce for a while now.
Break that trendline and clear $0.09871, and the picture opens up quite a bit, with $0.17782 as the bigger target further out.
Lose current support instead, and $0.05766 is the first level to watch, with $0.03349 as the deeper worst-case level on the weekly chart.
Vaulta Price Prediction August 2026: Bull, Base, and Bear Cases
This Vaulta Price prediction August 2026 really comes down to whether the price can climb back through a stack of resistance levels left behind by a long downtrend or whether that downtrend just keeps grinding on.
Both the daily and weekly charts show similar shapes: the price is stuck below a falling trendline, with a series of Fibonacci-based levels marking out what a real recovery would need to clear.
| Scenario | Target | Invalidation Level |
|---|---|---|
| Bull | $0.07946 – $0.10001 (Daily) $0.09871 – $0.17782 (Weekly) | Rejection at resistance; price fails to hold current support. |
| Base | $0.05749 – $0.07946 (Range-Bound) | Confirmed close outside either boundary. |
| Bear | $0.05749 – $0.03122 (Daily) $0.05766 – $0.03349 (Weekly) | Breakdown below current support on both timeframes. |
For the bull case to actually happen, buyers need to push the price back above $0.07946 on the daily chart with real volume, ideally while the weekly chart breaks its own downtrend at the same time.
Manage that, and $0.10001 comes into view on the daily side, with the much bigger weekly targets of $0.09871 and $0.17782 opening up if the recovery has real staying power.
The base case is a lot less dramatic; the price just keeps chopping in this general zone without confirming a real reversal either way
August 2026: Catalysts That Could Move Vaulta
Adoption of Vaulta's Web3 banking and asset tokenization push, any new institutional partnerships, and TVL trends this month are the main project-specific things worth watching.
Beyond that, whether price can actually break these long-standing downtrend lines on both timeframes will probably matter more to sentiment than anything else happening in the immediate news cycle.
What Analysts Are Forecasting (Vaulta)
Is this a good investment right now? That depends a lot on whether the rebrand to Vaulta ends up translating into real usage over time, since the chart itself is still stuck below a long-running downtrend on both the daily and weekly timeframes.
A confirmed break above $0.07946 and the weekly trendline together would be a meaningful signal that sentiment is genuinely shifting.
Without that, the safer assumption is that the broader downtrend still has the upper hand. This is chart-based analysis, not a guarantee of what happens next.
Vaulta Long-Term Outlook: 2027 to 2030
If price clears both the daily and weekly resistance zones over the coming months, a longer climb toward $0.09871 and potentially $0.17782 looks like a reasonable stretch target across 2027 and 2028.
Where this token actually lands by 2030 will depend far more on whether Vaulta's Web3 banking pivot actually gains real adoption than on any single chart pattern, though the current setup gives a useful place to start.
Risks That Could Invalidate This Forecast
The clearest risk is another rejection at resistance that leads to a break of current support on both timeframes.
That would open the path toward $0.05749 and the deeper $0.03122 level on the daily chart, with the weekly breakdown pointing toward $0.03349 in a genuinely bad scenario.
Given how thin current volume is, a low-conviction move in either direction wouldn't be surprising.
Disclaimer: This Vaulta Price prediction is for informational and educational purposes only and should not be considered financial or investment advice. Cryptocurrency markets are highly volatile, and prices can change rapidly. Always conduct your own research and consult a qualified financial advisor before making any investment decisions.











.jpg)






