Octra Price Prediction: Why Traders Are Watching This Breakout Closely


Octra price prediction is back on traders' radar, and for once, the chart is actually doing the talking.
Something quietly shifted.
No major announcement. No influencer pump. No coordinated push from Telegram groups. Octra just started moving.
And when we pulled up the chart to check what actually happened, the structure told a story most people are still catching up to.
We are not going to spoil it here.
But what we found was the kind of setup that makes you stop, go back, and look at the chart one more time just to make sure you are reading it right.
The Market Mood Around Octra Right Now
Traders are cautiously optimistic. Not hyped. Not all-in. Just watching.
That is actually a healthy sign.
When retail gets loud, tops form. When the crowd stays quiet and the chart builds structure in silence, that is where the real moves begin.
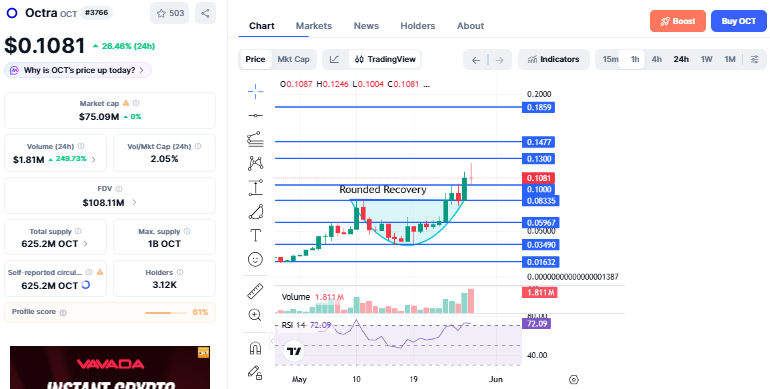
Octra sits at $0.1127, up 25.73% in 24 hours. Volume came in at $1.61M against a market cap of $75.09M. That volume-to-market-cap ratio of 2.05% is not screaming overheated. Not yet.
But here is what traders are missing: the formation that completed beneath this price action took weeks. Maybe longer. A rounded recovery, the slow, grinding kind, does not happen by accident.
Smart money noticed first.
What Changed Recently
For a long time, Octra was just another sub-$0.05 coin sitting in the shadow of bigger narratives. Price compressed into a tight range around the $0.034 zone. Volume was thin. Nobody was talking.
Then something shifted in wallet behavior. Quietly. The kind of shift you only see clearly after it has already happened.
Buyers started absorbing supply at the lows without fanfare. No spikes. No viral posts. Just accumulation that slowly, over several weeks, bent the price curve upward in that characteristic arc that technical traders recognize immediately.
The rounded recovery formation is completed. And then the breakout came.
That is where we are now.
Technical Analysis: What The Chart Is Actually Saying
The RSI is at 73.47, elevated, but not alarming. What matters more is how the price got there. It climbed gradually, not spiked.
Source: Data by Coinmarketcap
A spike to a 73 RSI usually means retail is panic-buying. A grind to 73 RSI means steady, sustained buying pressure. That's the healthier signal.
Volume backs this up. $1.61M is solid for this market cap, not tiny but not the kind of explosive volume you see at the top of an exhausted rally. It looks controlled and constructive.
The Bullish Case vs. Where It Could Break Down
The structure here is genuinely strong. RSI at 73.47 is pushing into overbought territory, but strong breakout moves often run hot before consolidating.
This is not a red flag by itself. A coin coming out of deep accumulation can carry elevated momentum for days before it breathes. And when you look at the Octra price prediction case being built here, that context matters more than any single indicator reading.
The bullish case is straightforward. Price has cleared multiple resistance levels. Volume confirmed the move. The rounded bottom gives this structure a measured-move target that points well above the current price.
And that is where things get interesting.
The $0.1300 psychological level is the first real test. Round numbers attract sellers. Always. Some traders who bought the recovery below $0.10 will look at $0.13 as an exit.
Whether buyers absorb that pressure or get pushed back will tell you everything about whether this move has real legs.
But honestly, if $0.1300 flips to support, the next target opens up toward the $0.1477 level on the chart.
Here is the risk: momentum altcoins at extended readings sometimes get violent pullbacks. If buying pressure fades here without reclaiming $0.1300 cleanly, a retest of $0.1000 becomes the base case.
Not a collapse. Just a reset. And that reset, if it comes, is exactly the kind of level the Octra price prediction bull case needs to hold to stay intact. Risk is still real.
Key levels:
$0.1000: psychological and technical. This level needs to hold on any retest.
$0.0833: next serious support if $0.10 cracks.
$0.0596: deeper structure support. Only relevant if something breaks badly.
$0.0340: the accumulation base. Nobody wants to see a return here, but it exists.
The immediate resistance is $0.1300. Above that, $0.1477 becomes the next significant level. A clean close above $0.1477 on strong volume would be meaningful.
Octra Price Prediction Scenarios for 2026
Bullish scenario: Price consolidates briefly around $0.11 to $0.13, builds a base, then breaks above $0.1477 with volume confirmation.
If that happens, the next measured move from the rounded bottom points toward the $0.20 to $0.25 range. That would represent a continuation of the recovery thesis with genuine momentum behind it.
Base scenario: Price oscillates between $0.10 and $0.1477 for several weeks. RSI cools. Volume normalizes. The coin enters a healthier accumulation phase at a higher base before attempting another leg up.
Bearish scenario: RSI at 73+ leads to a sharp fade. Price gives back the 24-hour gains and retests $0.0833. Buyers need to defend that zone aggressively, or the rounded recovery thesis gets questioned.
The probability weight right now leans bullish. But the $0.13 test is live.
Bottom Line
This setup deserves more respect than it is getting.
A rounded bottom formation with volume confirmation at current RSI levels is not something you see every week. The accumulation structure was patient. The breakout was clean. And the market is only now starting to pay attention.
We will not pretend there is no risk. An RSI this elevated always carries pullback potential. And $0.13 will attract sellers. That is just reality.
But if bulls absorb the selling pressure at $0.13 and close a daily candle above it, the next target opens fast. Bears who stayed short through this rounded recovery are already hurting. More pain could be coming for them.
The question is not whether Octra has a setup. It does.
The question is whether buyers show up when the first real test arrives.
DISCLAIMER: This article is for educational purposes only and does not constitute financial advice. Crypto markets are highly volatile. Consult your investment advisor before making investment decisions.

















