Official Trump price prediction: The Falling Knife Nobody's Catching


Official Trump Price Prediction 2026: The chart is saying one thing clearly right now, and it's not what bulls want to hear.
Three wallets. No public announcements. No tweets. Just three large wallets moved quietly while retail traders kept asking one question: Is TRUMP about to pump?
We tracked what the data was actually showing. And what we found raises a question the market hasn't fully answered yet.
TRUMP’s Next Move Could Be Violent
The first thing you notice on the macro chart is the shape.
It's a falling wedge that's been printing for months: a clean upper resistance line, a clean lower support, and price grinding toward the apex.
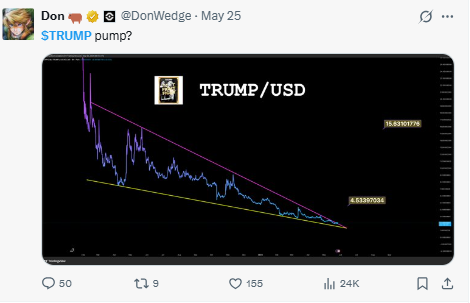
On X, a trader named @DonWedge flagged it with a simple question: $TRUMP pump?
That question is more loaded than it looks. Because a falling wedge can break either way. And right now, official Trump price prediction setups depend entirely on which wall gives first.
A Quick Reality Check on TRUMP Today
Source: Data By Coingecko
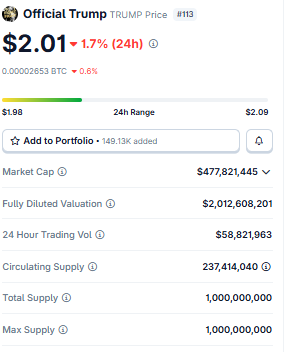
Look at the numbers.
Trump is sitting at $2.01, down 1.7% in 24 hours.
Market cap at $477 million.
Fully diluted valuation at over $2 billion.
That gap between market cap and FDV is worth pausing on: it means a significant portion of total supply hasn't entered circulation yet.
That's not a bullish signal for official Trump price prediction models. Trading volume in the last 24 hours was $58 million against a $477 million cap: not dead, but not loud either.
Circulating supply stands at 237 million against a total of 1 billion. The dilution math here is real, and smart money knows it.
The Catalyst Nobody's Talking About Yet
And here's the part that keeps coming up when we look at official Trump price prediction data closely.
There's no visible fundamental catalyst on the horizon right now. No major protocol upgrade. No liquidity event. No announced partnership.
What's moving this coin is almost entirely sentiment-driven, and sentiment right now is fragile.
Meme coins live and die on attention cycles. TRUMP had its moment. The crowd that chased it in the first wave has largely moved on. That matters more than most charts will show you.
Bears Have a Point Too
We won't dress this up. The official Trump price prediction setup is bearish, and the data supports that reading clearly. Price has been trending below the 10, 50, and 100 EMAs for an extended period.
That's not a short-term blip. That's a sustained directional statement from the market. Every attempted recovery has run straight into EMA resistance and rolled back over.
Until the price reclaims even the 10 EMA on a daily close, there's no structural reason to call a reversal in the official Trump price prediction picture.
Straight Talk From the Chart
We won't soften this. The 4-hour chart for the official Trump price prediction is one of the cleaner bearish setups we've seen this week.
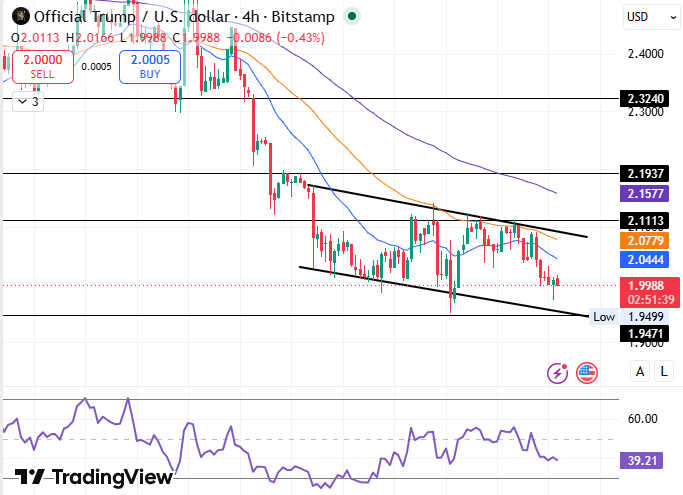
The price is inside a falling channel and is currently approaching the lower boundary, sitting at $1.9988 at the time of the chart capture.
RSI at 39.21: not oversold yet, but getting there. That reading tells you there's still active bearish pressure on the price.
Key resistance to watch:
2.1113 : EMA cluster zone, strongest near-term resistance
2.1937 : last major hurdle before open air
2.3240 : the big one, full trend reversal only above here
Key support to watch:
1.9471 : the line that matters most right now
If price breaks below 1.9471 and closes there on the 4-hour chart, the Official Trump price prediction setup is fully invalidated
No confirmed close below this level means the bounce thesis stays alive
A close below it changes everything for near-term recovery
One honest read here: the lower channel line may produce a short bounce. But a bounce inside a downtrend is still a downtrend.
The Levels Worth Circling on Your Screen
Here's what actually matters for official Trump price prediction traders watching this setup.
The lower channel boundary is the first decision point. If price taps it and RSI dips into the high 30s or touches 30, a short-term relief bounce is possible.
That bounce, if it comes, likely faces its first real test between $2.04 and $2.07.
Above that, the $2.11 zone is where most of the EMA resistance clusters. Breaking above $2.19 on volume would be the first real sign that the official Trump price prediction picture is shifting.
Until then, bounces are selling opportunities, not breakout signals.
Playing Out the 2026 Scenarios
The official Trump price prediction for the rest of 2026 splits into two paths.
Bearish base case: Price continues grinding lower inside the channel, tests the $1.94 low, and if that breaks, the $1.60 to $1.70 range comes into view. Meme coins at this stage of their cycle rarely find institutional floor support.
Bullish recovery case: The lower channel holds, and the RSI dips to oversold territory near 30; Bitcoin holds above key macro support, and TRUMP squeezes back toward $2.40 to $2.60 on momentum alone.
But that second scenario needs a broader market tailwind. Right now, that wind isn't blowing.
Looking Further Ahead: 2026 Possibilities
The multi-year official Trump price prediction is one of the harder calls in the meme coin space.
If the political narrative that originally drove this token fades entirely, the floor becomes very hard to estimate.
Meme coins without sustained utility or active community development tend to bleed slowly over 12 to 18 months after peak hype.
That said, a single news cycle, a single viral moment, can reprice a token like this overnight.
The 2026 picture for an official Trump price prediction depends almost entirely on whether new attention cycles arrive. No chart can model that.
What the Smart Money Might Already Know
The FDV versus market cap gap we noted earlier is the signal most retail traders walk past.
Smart money running official Trump price prediction models knows that $2 billion in fully diluted valuation against $477 million in current market cap means significant future sell pressure if the remaining supply unlocks.
That's not fear-mongering. That's just math. And it's the kind of math that keeps larger players cautious about building big positions at current levels.
Verdict: Official Trump in 2026: Worth It or Skip It?
Here's the plain read on the official Trump price prediction right now. If you're a short-term trader, the only trade worth considering is a bounce play off the lower channel, with a very tight stop below $1.94.
If it breaks there, there's no obvious floor until significantly lower. If you're a medium-term holder, the structure doesn't support adding here.
Wait for a confirmed break above the falling channel on volume before reassessing the official Trump price prediction thesis. And if you're long-term, this is a meme coin. Size accordingly.
DISCLAIMER: This article is for educational purposes only and does not constitute financial advice. Crypto markets are highly volatile. Before making any type of investment decisions, consult your investment advisor.
Also read:

















