Ondo Price Prediction: Is ONDO Ready for Its Next Big Move?


Ondo is back at a critical technical crossroads. After failing to hold a recent breakout above its long-standing descending channel, $ONDO has slipped back into the pattern and is once again testing trader conviction.
The next move from this zone could determine whether buyers regain control or sellers extend the correction.
This Ondo price prediction looks at what futures traders are doing, the fresh holder data behind the network, and the chart levels that matter most from here.
Why Is Ondo's Price Sliding Today?
$ONDO is trading near $0.3509, down 5.04% over the past 24 hours. The decline follows a failed breakout above the descending channel, while broader market weakness and long liquidations have added further selling pressure.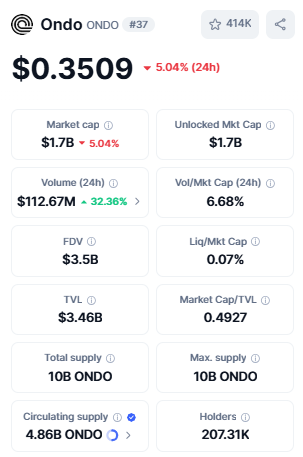
Market cap has slipped in step with the price, currently sitting around $1.7B, while 24-hour trading volume has actually jumped 32.36% to $112.67M, suggesting heavier participation even as the price cools off.
The token's holder base stands at 207.31K, with a circulating supply of 4.86B $ONDO out of a 10B max supply.
Data source: CoinMarketCap
Is Ondo's Real-World Asset Growth Still Intact?
Away from the price action, Ondo's tokenized asset ecosystem keeps expanding. Token Terminal data shows $Ondo issued assets have grown to more than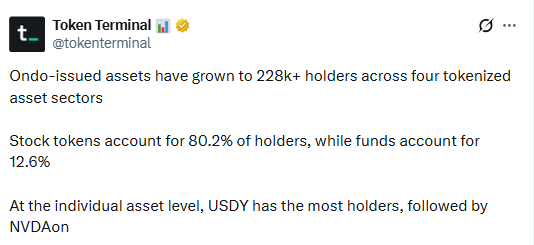
228,000 holders across four tokenized asset sectors, with stock tokens making up 80.2% of holders and funds accounting for 12.6%.
At the individual asset level, USDY holds the largest share of holders, followed by NVDAon.
Despite the recent correction, $Ondo's real-world asset ecosystem continues to expand, showing that network adoption has remained resilient even as the token price weakens.
What Are Futures Traders Doing With ONDO?
Long/short positioning leans bullish across the board. On Binance, the ONDO/USDT Long/Short ratio (accounts) sits at 1.129, while OKX shows a much stronger skew at 3.73.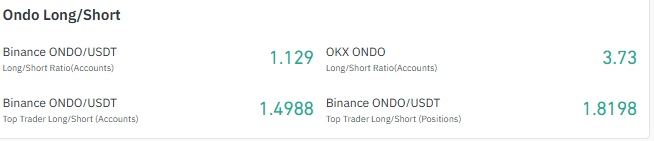
Binance's top traders are even more one-sided, with an account-based ratio of 1.4988 and a position-based ratio of 1.8198, both pointing to more long exposure than short.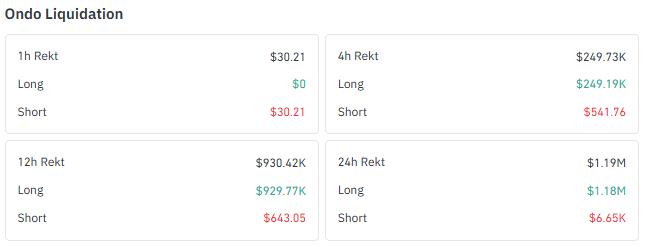
That bullish tilt hasn't stopped the bleeding, though. Liquidation data shows longs have taken the brunt of the damage: over the past 24 hours, $1.19M was liquidated, with $1.18M coming from long positions against just $6.65K in shorts.
The pattern holds across shorter windows too, with $929.77K in longs liquidated in the past 12 hours versus just $643.05 in shorts.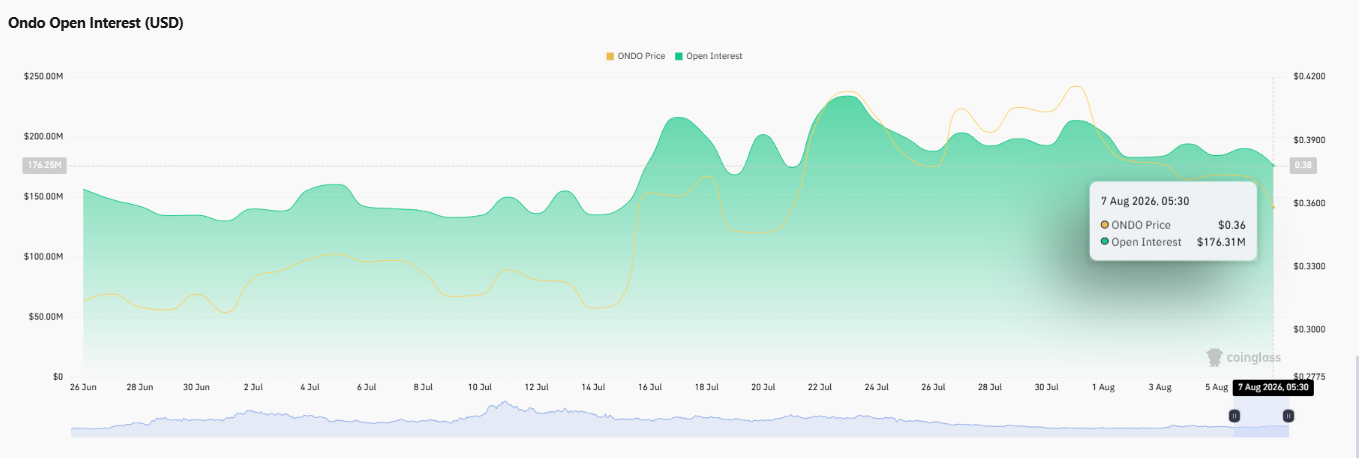
Open Interest currently sits at $176.31M, down from a late July peak near $230M but still well above the roughly $130M baseline seen through most of the summer.
This suggests traders are still actively participating in $ONDO derivatives despite the recent correction, indicating that volatility is likely to remain elevated.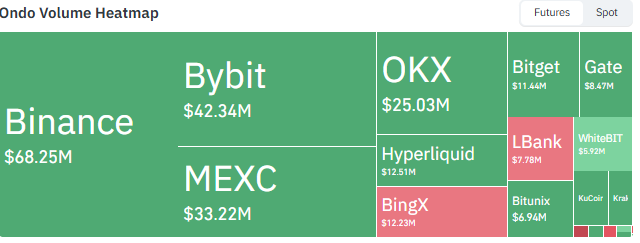
Trading activity is led by Binance ($68.25M), followed by Bybit ($42.34M) and MEXC ($33.22M), with meaningful volume also on OKX, Hyperliquid, and BingX.
Data source: coinglass
Is Ondo's Descending Channel About to Trap Buyers Again?
On the TradingView daily chart, ONDO remains inside a descending channel that followed a long consolidation phase between February and April.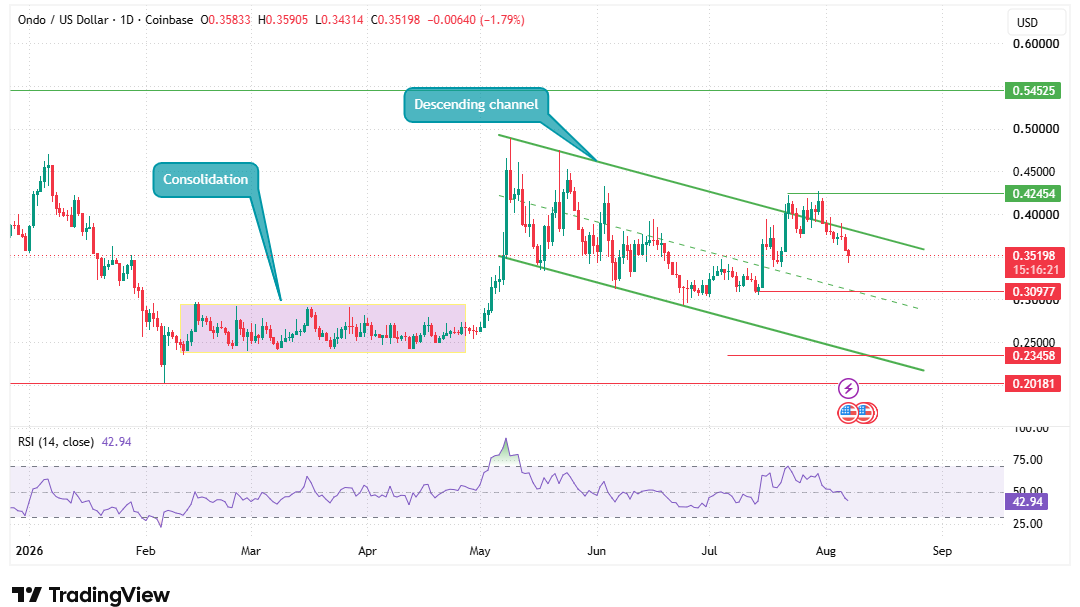
The token recently tried to break out above the channel, but buyers couldn't hold the higher levels, and the price was pulled back inside the pattern, reinforcing the channel's control for now.
As long as $ONDO holds its current range and finds support, a recovery could target $0.42454, followed by $0.54525.
A confirmed breakdown below $0.30977, on the other hand, would expose the next support levels at $0.23458 and $0.20181.
The 14-day RSI sits at 42.94, still below the neutral 50 mark, which keeps a slight bearish edge in play.
A confirmed daily close above the channel remains the first technical signal that the broader bearish structure is beginning to weaken.
Where Could Ondo Head From Here?
Scenario | Key Levels |
Bullish Scenario | Holding support and reclaiming the descending channel opens the path toward $0.42454, with $0.54525 as the extended target. |
Neutral Scenario | ONDO continues to range inside the channel between $0.30977 and $0.35, without a confirmed break either way. |
Bearish Scenario | A confirmed breakdown below $0.30977 shifts focus toward $0.23458 and $0.20181. |
How Has Ondo Performed Across Different Timeframes?
The picture looks mixed once you zoom out. ONDO is down 15.68% over the past 7 days and 22.14% over 90 days but up 7.04% over the last 30 days and a strong 33.28% over 180 days.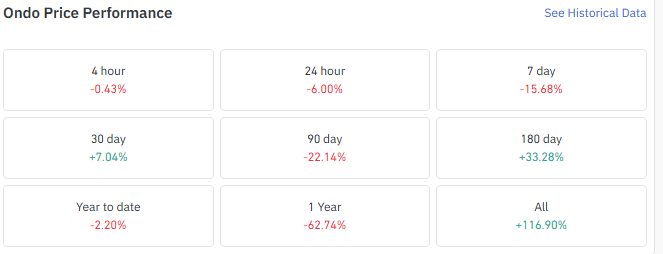
Longer term, the token is down 2.20% year to date and 62.74% over the past year, yet still up 116.90% since its all-time reference point, a reminder of just how volatile $ONDO's trading history has been.
Data source: coinglass
What's Next for Ondo?
As per the Coingabbar analyst, ONDO is approaching one of its most important technical zones in recent weeks. While growing adoption across its tokenized asset ecosystem continues to support the project's long-term fundamentals, short-term price action remains constrained by the descending channel.
Until buyers reclaim the upper trendline, rallies are likely to be viewed as corrective rather than the start of a sustained uptrend.
Disclaimer: This article is for informational purposes only and should not be considered financial or investment advice. Cryptocurrency markets are highly volatile; always conduct your own research before making any trading decisions.