Ondo Price Prediction: Can ONDO Reclaim $0.48 Next?


Ondo price prediction interest is building again as $ONDO settles into a tight range after a rough stretch that tested every level of support in its path.
What happens next depends on whether buyers can use this pause to build real momentum or whether it turns into just another pit stop on the way down.
The setup below breaks down exactly what would confirm either outcome, and it builds on our earlier look at why ONDO is up from this same stretch.
The levels described here apply strictly to the 4-hour timeframe covered and should be rechecked if the price closes beyond the stated range.
$ONDO Price Right Now
Metric | Value |
Price | $0.3708 |
24h Change | -4.21% (-$0.01629) |
Market Cap | $1.80B |
Futures Volume (24h) | $217.03M |
Spot Volume (24h) | $44.65M |
Open Interest | $203.54M |
Circulating Supply | 4.86B $ONDO |
Total Supply | 10.00B $ONDO |
Max Supply | 10.00B $ONDO |
Open interest refers to the total value of $ONDO derivative contracts still open across exchanges, a rough gauge of active leveraged positioning.
Chart source: ONDO/USDT 4-hour perpetual, TradingView, Binance data feed, captured August 3, 2026, around 4:15 PM IST.
Market cap, volume, and supply figures from ONDO market data on CoinGlass were captured the same day.
Methodology and Data Sources
This price prediction uses the ONDO/USDT 4-hour chart on Binance via TradingView for price structure, with volume, open interest, and market cap figures from CoinGlass, and liquidation flow from CoinGlass's ONDO liquidation tracker.
Readers who want a deeper look at the earlier breakout attempt can also check our ONDO bullish breakout target coverage.
All levels are treated as invalidated only on a confirmed candle close beyond the stated trigger, not an intraday wick.
Since this setup is built purely off the 4-hour timeframe, it is worth rechecking once the price closes clearly above or below the range described below.
$Ondo News: Tokenized Stock Volume Update
Adding fresh context to this ONDO price forecast, on-chain analyst Dami-Defi reported on August 2, 2026, that $Ondo has distributed $845M in tokenized stocks, putting it at roughly 45% market share in that category.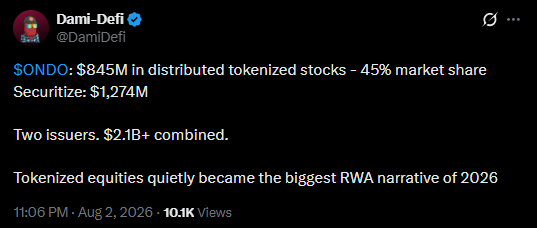
The same report puts Securitize at $1,274M, bringing the combined total across both issuers to more than $2.1B, and frames tokenized equities as the biggest real-world asset narrative of 2026.
Source: Dami-Defi tokenized stocks update on X, posted August 2, 2026, checked August 3, 2026.
This kind of adoption data does not move price directly, but it adds a fundamental angle worth tracking alongside this $ONDO technical analysis.
$ONDO Liquidation Data Today
Liquidation activity over the past hour leaned heavily toward longs, with $8.23K total liquidated, made up of $7.25K from longs and $972.44 from shorts.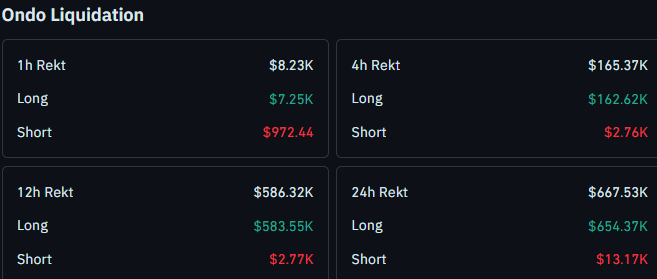
The 4-hour window shows a much sharper lean, with $165.37K in total liquidations, of which $162.62K came from longs and just $2.76K from shorts.
Over 12 hours, total liquidations reach $586.32K, with $583.55K from longs and only $2.77K from shorts.
Across the full 24 hours, liquidations hit $667.53K, and longs account for $654.37K of that figure, while shorts make up just $13.17K.
This heavily long-side liquidation pattern lines up with the sharp fall that followed the failed trendline retest
Source: ONDO liquidation data, CoinGlass, checked August 3, 2026, around 4:15 PM IST.
Key Takeaways
$ONDO broke its prior ascending trendline, retested it, and fell again before breaking a recent swing low.
Price is now consolidating and trying to push higher after that swing low break.
A close above $0.3966 opens the door to $0.4275, $0.4518, and $0.4883.
A close below $0.3373 puts $0.3050 in view as the next support.
Longs have taken the overwhelming majority of liquidations across every window from 1h through 24h.
$ONDO 4-Hour Chart Analysis
On the 4-hour chart, $ONDO broke its prior ascending trendline and came back to retest it from below, but that retest attempt failed and the price fell again.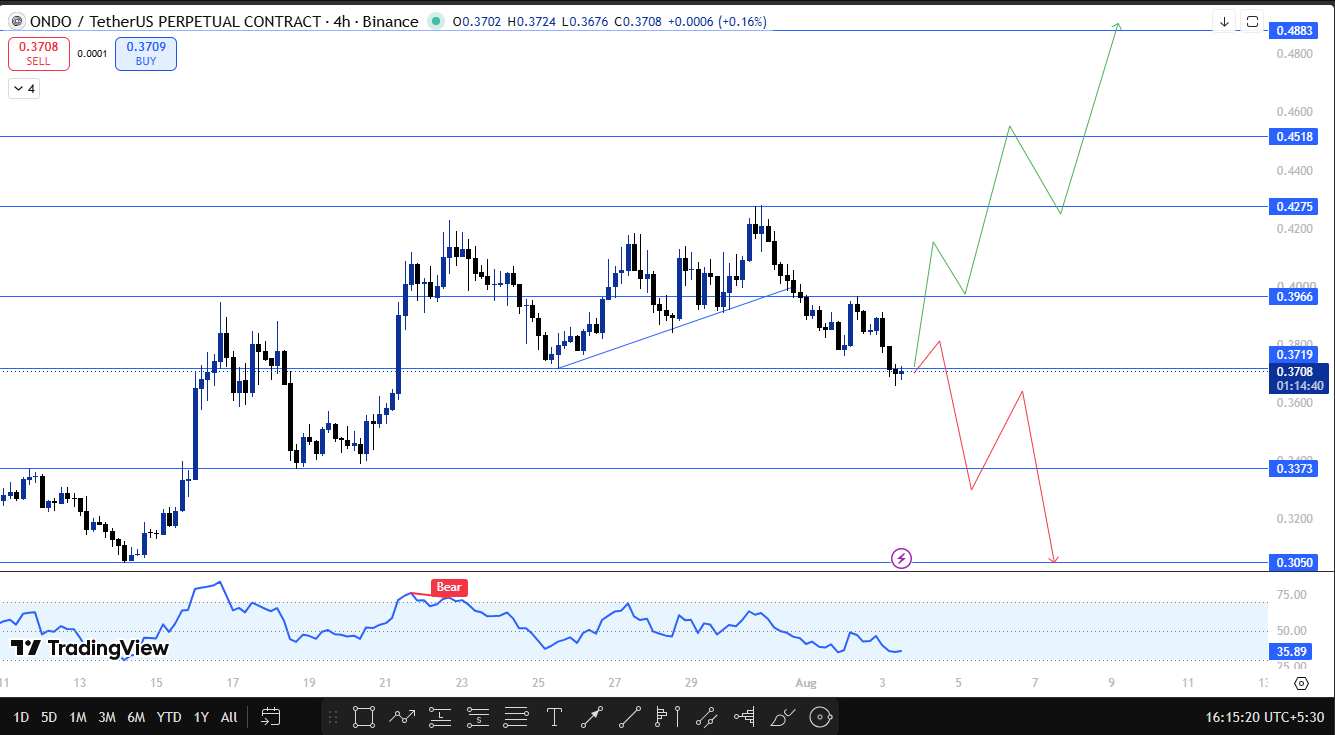
That second leg down pushed through a recent swing low before finally finding footing.
Since that swing-low break, $ONDO has been consolidating and trying to work its way higher. A pattern also explored in our ONDO can it reach coverage.
The RSI is currently reading near 35.89, cooling off after an earlier bearish divergence flagged on the higher move in late July, though it remains on the softer side for now.
If it grabs liquidity from this consolidation and breaks and closes above $0.3966, the next resistance zone to watch is $0.4275, followed by $0.4518 and $0.4883.
If instead the price breaks and closes below $0.3373, that puts $0.3050 in view as the next support.
$ONDO Technical Outlook Snapshot
Indicator | Signal |
Trend | Broke and retested its prior ascending trendline, then fell through a recent swing low |
Structure | Consolidating after the swing-low break, attempting to push higher |
RSI | Reading near 35.89, cooling from an earlier bearish divergence flag |
Liquidations | Longs dominate every window from 1h through 24h |
BTC Correlation | Broader market tone is likely to matter as much as this chart structure |
$ONDO Support and Resistance Levels to Watch
These levels track $ONDO's most recent swing structure on the 4-hour chart, a setup also discussed in our ONDO historic high outlook.
Type | Level | Note |
Resistance 3 | $0.4883 | Extended upside target |
Resistance 2 | $0.4518 | Next hurdle after $0.4275 |
Resistance 1 | $0.4275 | The next hurdle after the liquidity grab trigger |
Breakout Trigger | $0.3966 | Confirmation trigger after grabbing liquidity from this consolidation |
Current Price | $0.3708 | Consolidating after the recent swing low break |
Support 1 | $0.3373 | Key closing-basis level, breakdown trigger |
Support 2 | $0.3050 | Next support if $0.3373 fails |
Risk-Reward Table
Case | Trigger | Target |
Bull Case | Grabs liquidity and closes above $0.3966 on the 4-hour timeframe. | Move toward $0.4275, then $0.4518 and $0.4883. |
Bear Case | Breaks and closes below $0.3373 | Slide toward $0.3050 and lower. |
Invalidation Level
This price prediction stays neutral to cautious as long as $ONDO trades below $0.3966 on a closing basis.
A confirmed close below $0.3373 would confirm renewed weakness and shift focus to $0.3050, with further downside possible from there.
If $ONDO instead grabs liquidity from this consolidation and closes above $0.3966, that would mark the first real reversal signal after the swing low break, with $0.4275, $0.4518, and $0.4883 opening up as targets.
How Bitcoin Could Influence $ONDO
This setup is based on ONDO's own 4-hour chart, but Bitcoin still tends to set the tone for how far altcoin moves like this one can extend.
If Bitcoin holds firm or trends higher, it generally improves the odds of ONDO clearing $0.3966 and working toward $0.4275, $0.4518, and $0.4883.
A weaker Bitcoin tape raises the risk that ONDO stays capped in this consolidation or slides toward $0.3373 and $0.3050.
Many traders also watch Bitcoin dominance as a rough gauge of whether capital favors majors or altcoins, though this analysis does not track dominance figures directly and treats it only as general market context.
Planned Update
This Ondo price prediction will be revisited if ONDO confirms a close above $0.3966 or below $0.3373, or if fresh liquidation, volume, or tokenization data meaningfully changes the setup described here. Broader coverage on this coin is available in our price prediction hub.
The publish date will not be updated unless one of these material changes occurs.
Glossary
Ascending Trendline: An upward-sloping line connecting successive higher lows, used to track support during an uptrend.
Swing Low: A local low point on the chart where the price reversed higher, often used to judge whether a downtrend has broken structure.
Liquidity Grab: A short move that triggers stop-loss or resting orders just beyond a level before the price reverses in the opposite direction.
Open Interest: The total value of derivative contracts, like futures, that remain open and have not yet been settled or closed.
RSI (Relative Strength Index): A momentum indicator used to judge whether an asset has moved too far too fast in one direction.
Liquidation: What happens when a leveraged trade gets forcibly closed because the trader ran out of margin to keep it open.
CoinGabbar's Technical Analyst View
The swing-low break followed by consolidation is the part of this ONDO chart worth watching closely, since it shows price trying to stabilize rather than continuing straight down after the failed trendline retest.
Whether that stabilization turns into a real liquidity grab and breakout will likely decide the next leg.
If it breaks and closes above $0.3966, a move toward $0.4275, $0.4518, and $0.4883 comes into view.
A break and close below $0.3373 would point to $0.3050 and further downside as the breakdown scenario plays out.
Disclaimer
This Ondo price prediction is based on technical chart analysis and market data available at the time of writing. Cryptocurrency markets are highly volatile, and prices can change rapidly. This content is for informational purposes only and should not be considered financial advice. CoinGabbar and the analyst do not hold a position in this . Always do your own research and consult a qualified financial advisor before making any investment decisions.


















