Orochi Network Price Prediction: Can $ON Hold This Rally


Search interest in Orochi Network price prediction is spiking today after a quiet zero-knowledge project posted one of its loudest days ever, and traders are scrambling to figure out if it means anything.
Why Is Orochi Network Suddenly Everywhere on Trading Screens?
Something woke $ON up. It didn't creep higher; it jumped. And when a token that's spent most of the year grinding sideways suddenly rips double digits before lunch, people notice fast. Traders scanning our latest crypto news feed saw $ON climbing the day's leaderboard within hours.
Orochi Network builds zero-knowledge infrastructure, the kind of tech that lets someone prove a claim is true without showing the private data behind it. Not the flashiest pitch in crypto. But infrastructure plays have a habit of going unnoticed for months and then getting re-rated all at once.
Is that what's happening here, or is this just leverage doing what leverage does? Let's get into it.
Key Takeaways
-
Direction: Short-term momentum is bullish, riding a rounded-bottom breakout and a live ascending channel.
-
Current price: Around $0.22, up roughly 65% in 24 hours.
-
Key support: $0.1724, with a deeper floor near $0.1144.
-
Key resistance: $0.2568, then $0.2690 and $0.3119.
-
Invalidation: A daily close under $0.1724 breaks the bullish structure; a close under $0.1144 confirms a bearish reversal.
-
Base case: Cooldown toward $0.17 to $0.19 before another push higher.
Table of Contents
-
What Actually Happened
-
Technical Chart Analysis
-
On-Chain Data: Whale Concentration
-
Tokenomics and Supply
-
Scenario Table
-
Risks to Watch
What Actually Happened
Here's the thing: there's no single confirmed press release behind this move. What we found instead was a recent Orochi Network post on zero-knowledge proof of reserves, tied to its zkDatabase product. That's a product update, not a listing headline.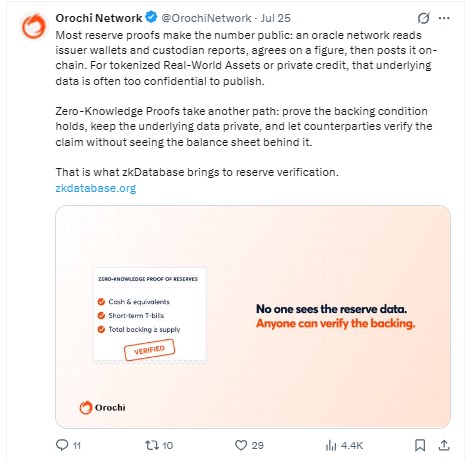
And the price action doesn't look purely organic either. Per CoinGlass liquidation data, ON saw $1.44M in total liquidations over 24 hours. Of that, $925.05K came from short sellers getting forced out. Shorts had piled in against a token near its all-time low. When the price turned, they got squeezed.
Basically, thin books plus crowded shorts plus a real tech narrative equals a violent green candle. That combination cuts both ways.
This follows an earlier leg discussed in our Binance Alpha box rally breakdown, so this isn't ON's first sharp move this cycle. We also flagged the setup building in our earlier ascending channel breakout coverage.
Technical Chart Analysis
4-Hour Chart: Ascending Channel
On the 4-hour TradingView chart, ON is riding a clean ascending channel that's been held since early July. Price sits near $0.2171, just under the channel's upper boundary.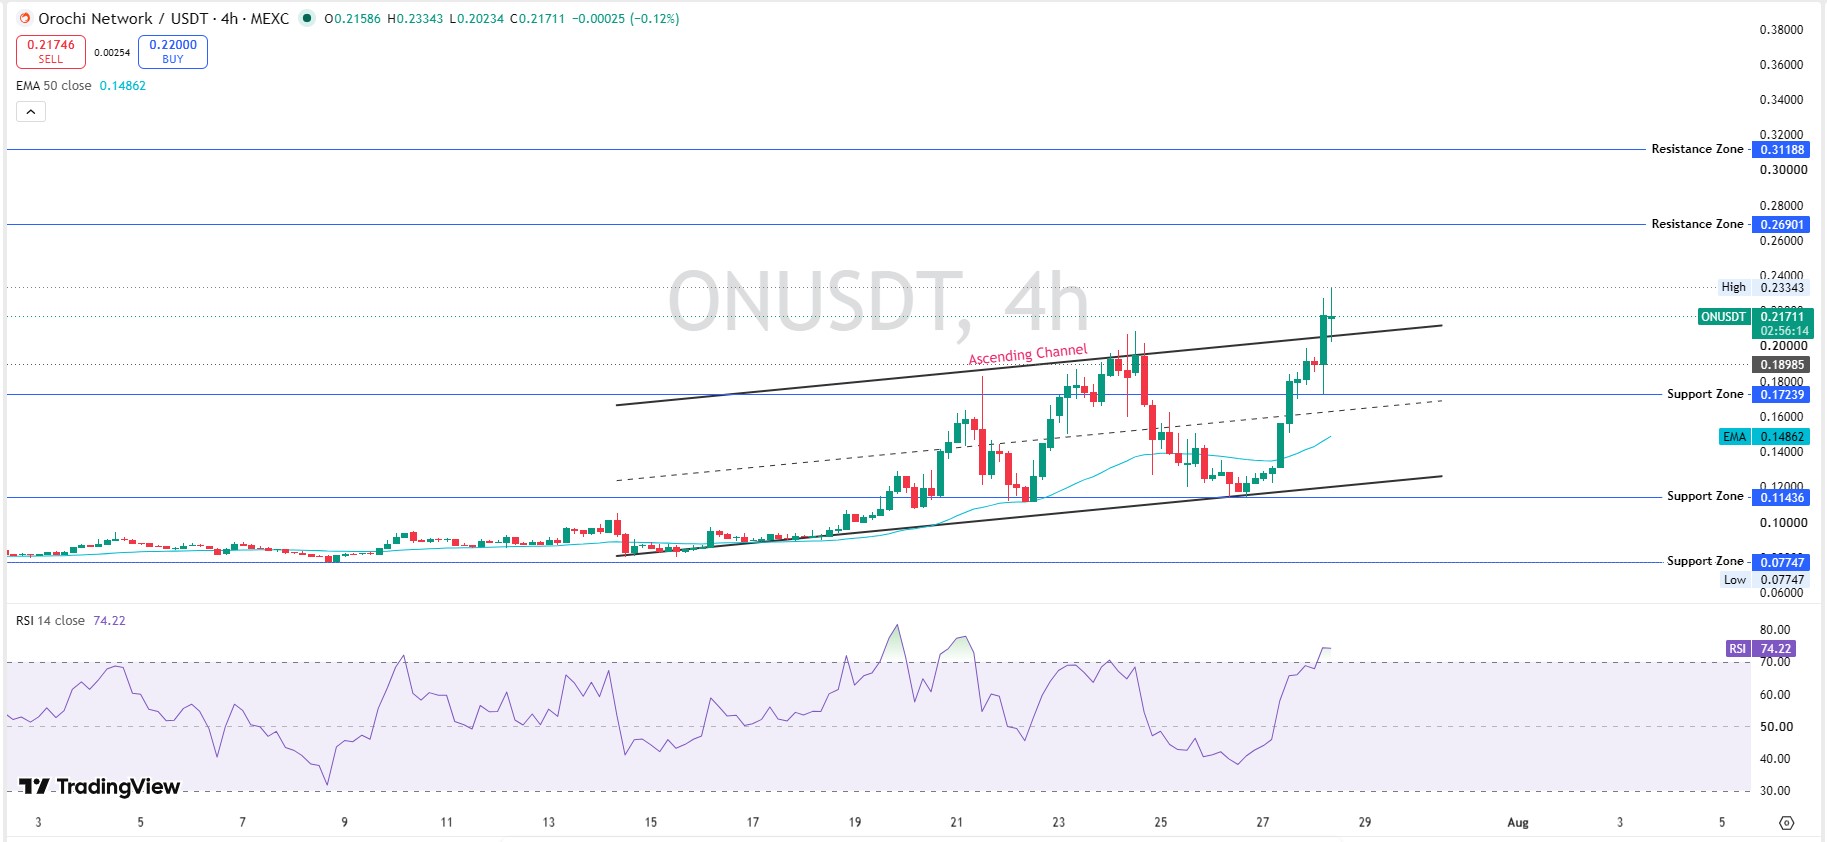
RSI-14 (a momentum gauge, overbought above 70) reads 74.28. That's hot. Turns out, moves this stretched rarely hold in a straight line, and a pullback toward the 50-EMA near $0.1486 wouldn't shock anyone.
Resistance zones sit at $0.2690 and $0.3119. Support holds at $0.1724, then $0.1144.
Daily Chart: Rounded Bottom Breakout
Zoom out and the picture calms down. The daily chart shows a textbook-shaped rounded bottom, a slow curve up out of a multi-month base, not a spike.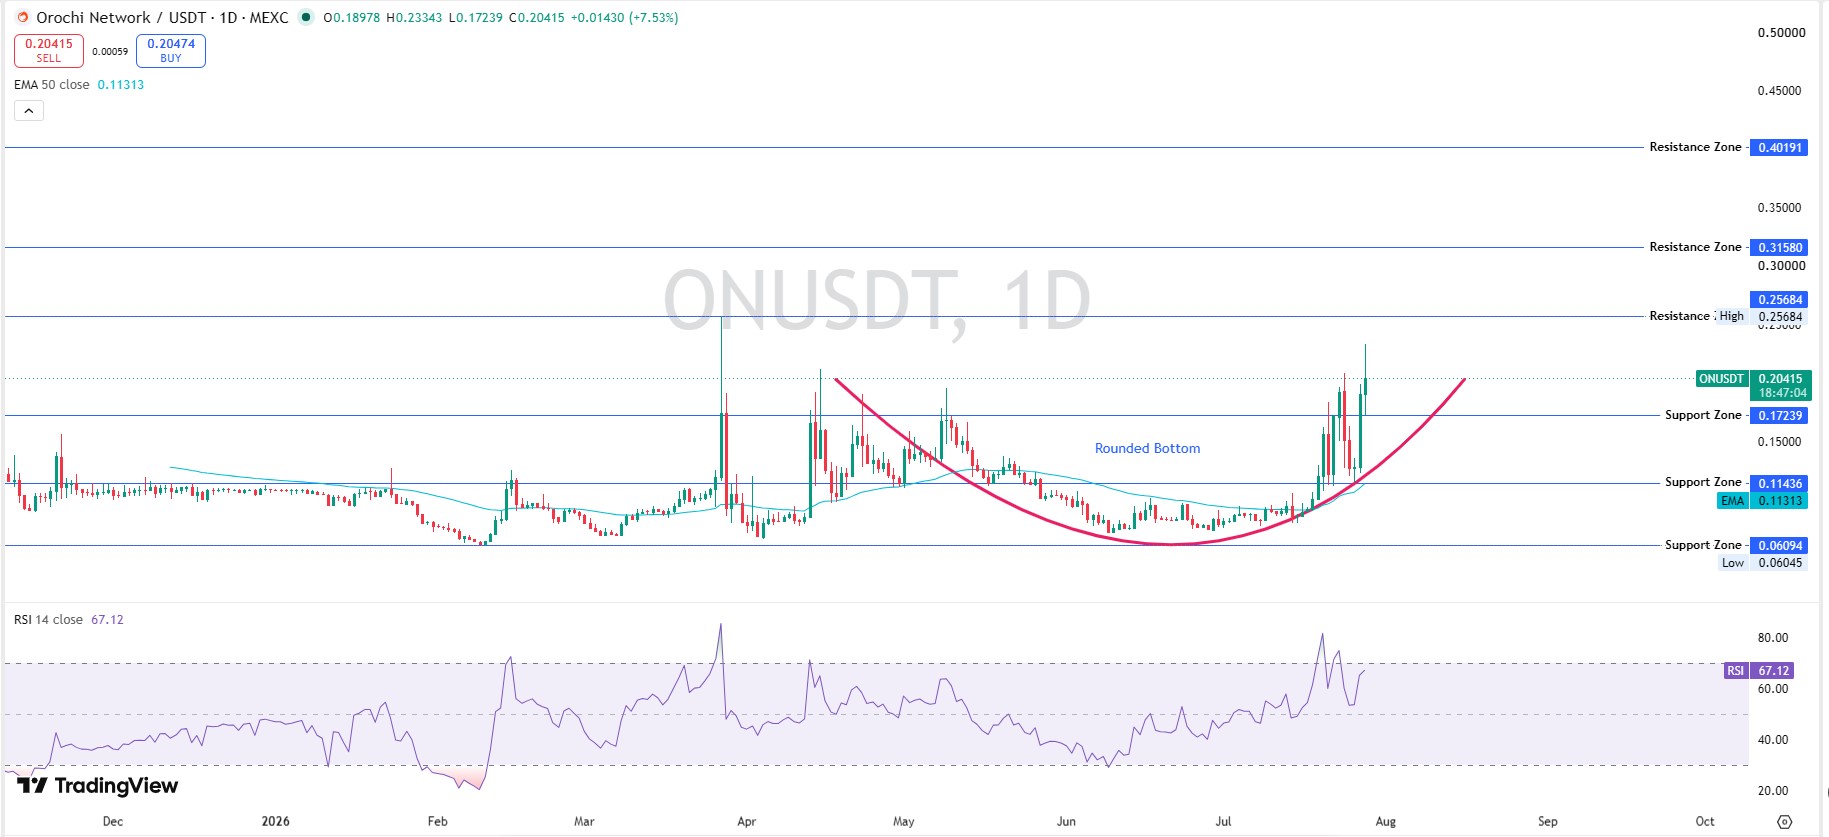
Daily RSI reads 67.12, still short of overbought. There's room left here.
Resistance stacks up at $0.2568 (recent high), then $0.3158, then $0.4019. That last level lines up with where ON was trading before its steepest slide.
So daily, it says there's a runway. 4-hour says take a breath first. Both can be true.
On-Chain Data: Whale Concentration Risk
We pulled the holder data, and honestly, it's lopsided. Per the top holder rankings on Etherscan, the single largest wallet holds 22.46% of tracked supply. The next three combined hold another 46%.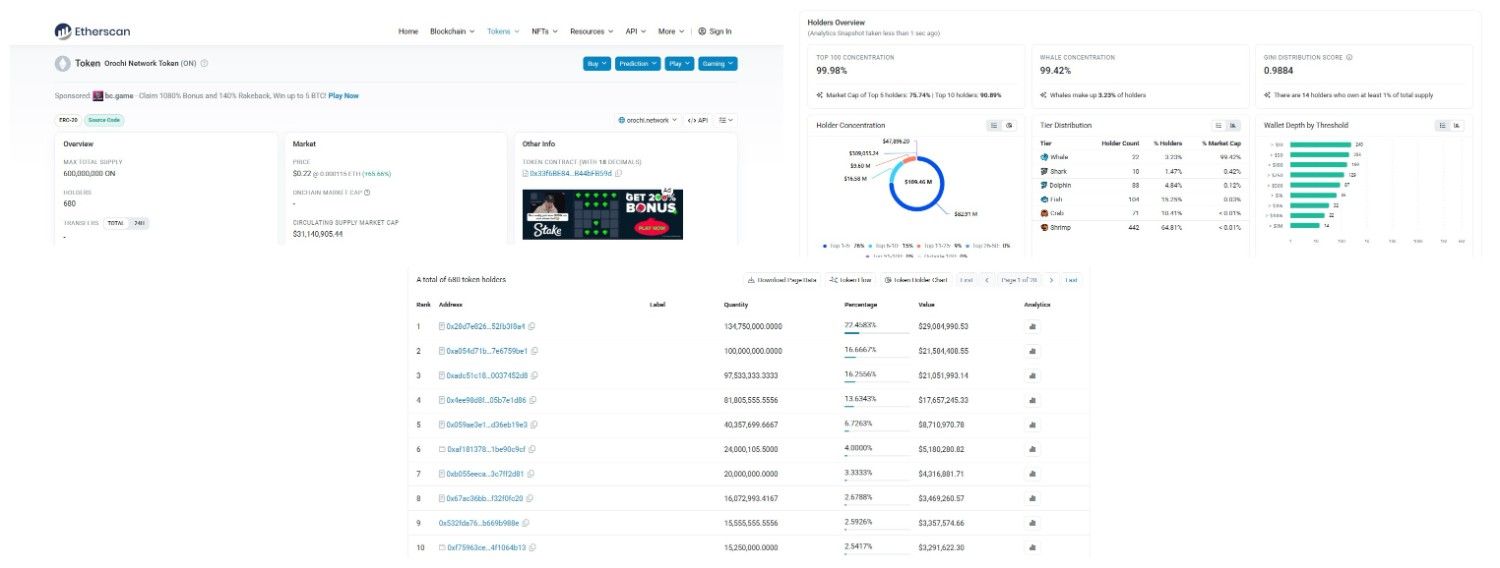
One flagged wallet at rank six carries a different, contract-style address format rather than a typical externally owned account. That pattern often points to an exchange or liquidity wallet rather than a person, though its exact function isn't confirmed here.
Whale concentration overall sits at 99.42% of value held by just 3.23% of holders, with a Gini distribution score of 0.9884. That's about as unequal as token distribution gets. Fourteen wallets alone each hold over 1% of the supply.
One thing is worth flagging on its own: reported holder counts differ across sources, 680 on the tracked explorer view versus over 3,000 on CoinMarketCap. That gap likely reflects different snapshot timing or chain scope, and it's worth confirming directly before treating either number as final.
Tokenomics and Supply
The circulating supply sits near 144.27M ON against a reported 1B max supply, per CoinMarketCap. FDV runs to roughly $220.68M versus a $31.83M market cap, a steep gap that says most of the theoretical supply isn't circulating yet.
Liquidity versus market cap sits at just 3.69%. Thin. That's exactly the kind of setup that produces the sharp wicks we're seeing on the chart.
Volume tells its own story too. Per the exchange heatmap, Binance alone carries $193.25M of futures volume, dwarfing every other venue combined. This move is leverage-heavy, not spot-driven conviction. Worth remembering before chasing it.
Scenario Table
| Timeframe | Bull Case | Base Case | Bear Case |
|---|---|---|---|
| Short-term (Days) | Holds above $0.20 and pushes to retest $0.2690. | Cools to the $0.17–$0.19 range as RSI resets. | Fails at $0.19 and retests $0.1724. |
| Weekly | A daily close above $0.2568 opens the path toward $0.3119. | Trades sideways between $0.17 and $0.26. | Loses $0.1724 and drifts toward $0.1144. |
| Monthly | Strong volume and zk-narrative demand lift price toward $0.35–$0.40. | Consolidates within the $0.18–$0.28 zone. | Breaks below $0.1144 and revisits prior lows near $0.06. |
| Long-term (Speculative) | Adoption of the zk-proof product line supports a recovery toward prior highs near $0.40. | Remains range-bound as supply and demand stay balanced. | Weak follow-through and thin liquidity keep ON grinding lower. |
These longer targets lean heavily on adoption actually showing up. Treat them as a framework, not a promise.
Risks to Watch
Whale concentration tops the list, plain and simple. A handful of wallets holding this much supply means coordinated selling could hit hard.
Leverage is another. With futures volume this dominant on one exchange, any liquidation cascade in either direction could move price fast.
And the holder-count discrepancy between sources is worth resolving before treating any single figure as gospel. Don't skip that step.
For broader market context, our Bitcoin price prediction 2026 and Ethereum price prediction 2026 pieces cover how majors are shaping altcoin risk appetite right now.
Methodology
Chart levels came from 4-hour and daily ON/USDT charts on TradingView via MEXC, using RSI-14, EMA-50, and visible channel structure, and were captured July 28, 2026. Supply and market data came from CoinMarketCap and Etherscan. Liquidation and exchange-volume data came from CoinGlass.
Holder concentration came from the token's on-chain top-accounts list. Figures were cross-checked against the screenshots reviewed for this piece. This is speculative market commentary, not financial advice, and you should check our live crypto news and coin events calendar for anything that's shifted since.
Disclaimer: This is speculative market commentary, not investment advice. Crypto assets are volatile and can lose most or all of their value. Do your own research before trading.