OVERTAKE Price Prediction: TAKE Rally, AlphaX Futures & 10x Leverage


OVERTAKE Price Prediction: Can TAKE Hold Its 83% Breakout?
OVERTAKE price prediction is suddenly the phrase everyone in the smaller altcoin corners of crypto Twitter is typing out. TAKE went from a coin most people had never heard of to one that jumped over 80% in a single day, and that kind of move tends to grab attention fast. The chart shows a coin that spent months going nowhere and then, almost overnight, decided to wake up.
Key Takeaways
Direction: Short-term bullish, but stretched on the daily chart
Reason: Sharp breakout after months of consolidation; new futures listing added fresh volume
Short-term range: Roughly $0.058 to $0.085
Invalidation: A daily close back below $0.0367 would flip the setup bearish
Why Is Everyone Suddenly Talking About OVERTAKE Right Now
OVERTAKE price prediction searches are climbing because TAKE just did something most quiet altcoins never manage. Turns out, a token that traded under four cents for weeks can still surprise people. If you're tracking similar setups across the market, this crypto exchange listing tracker is worth keeping open alongside this piece.
Basically, the price broke out of a long sideways range and did it with real volume behind it, not just a thin candle on low liquidity.
But here's what most traders are missing: this move did not come from nowhere. There's a listing story, a holder concentration story, and a chart structure story all happening at once. For a closer look at how concentrated the supply really is, the whale concentration breakdown covers that angle in more depth.
So is this the start of something bigger, or is this the kind of spike that fades just as fast as it came?
What Is OVERTAKE and Why Does the TAKE Token Even Matter
OVERTAKE runs its TAKE token as a BEP-20 asset on BNB Chain, according to BscScan, while the wider Overtake ecosystem is built around a gaming and perpetuals marketplace connected to the Sui network. The project positions itself in the gaming plus trading niche, a category that has pulled in fresh attention this cycle.
Coin Overview and Live Market Snapshot for OVERTAKE
Field | Data |
Coin Name | Overtake |
Ticker Symbol | TAKE |
Blockchain | BNB Chain (BEP-20) |
Today High | $0.06974 |
Today Low | $0.03673 |
RSI Level | 78.43 (Daily) |
Token Type | Utility / Gaming |
Token Category | GameFi, Perpetuals |
Contract Address | 0xE747E54783Ba3F77a8E5251a3cBA19EBe9C0E197 |
Market Cap | $22.39M |
24H Trading Volume | $10.07M |
24H Volume Change | +163.47% |
Circulating Supply | 332.57M TAKE |
24H Change | +45.82% |
Source: Data by CoinMarketCap
How the OVERTAKE Ecosystem Started and Why Holders Care
Overtake positions itself as a gaming marketplace with perpetuals trading built in, connecting to the Sui ecosystem for its gaming layer while the TAKE token itself lives on BNB Chain. It launched into a market that has been hungry for GameFi projects with a working product rather than just a roadmap.
For beginners, think of it as a place where gaming activity and trading activity are meant to feed into each other, with TAKE acting as the token that ties both sides together. Anyone weighing this against smaller-cap plays might also want to scan this week's best meme coins roundup for comparison.
Why This Coin Is Getting Attention Beyond Just the Chart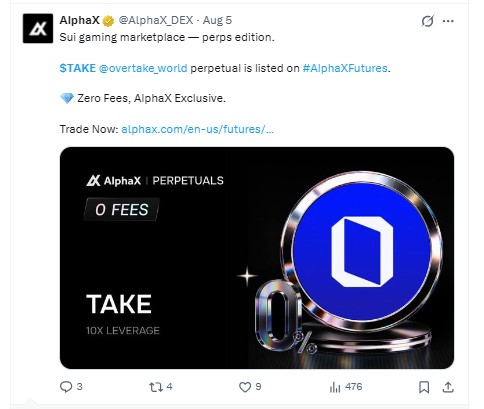
According to the project's official X account, a new futures listing just went live. As per the AlphaX DEX account on X, the STAKE perpetual for Overtake was listed on AlphaX Futures on August 5, offering zero fees and ten times leverage.
That kind of listing usually pulls in fresh trading volume fast, and the chart backs that up. But new venues also mean new leveraged positions, and leveraged positions eventually get liquidated in both directions. Traders keeping an eye on upcoming vesting events might also check this week's token unlocks calendar before sizing new positions.
OVERTAKE Liquidation Data Shows Both Sides Getting Squeezed
As per CoinGlass, the last 24 hours saw $180.09K in total liquidations, split between $58.34K in longs and $121.75K in shorts. The 4-hour window alone saw $112.32K wiped out, with shorts taking the bigger hit at $74.96K.
Fundamental Backdrop Behind the Latest TAKE Price Surge
The fundamental picture here is mixed. On one hand, holder concentration is extreme: according to BscScan, the top 100 wallets control 99.52% of supply, and whales alone make up 75.30% of holdings.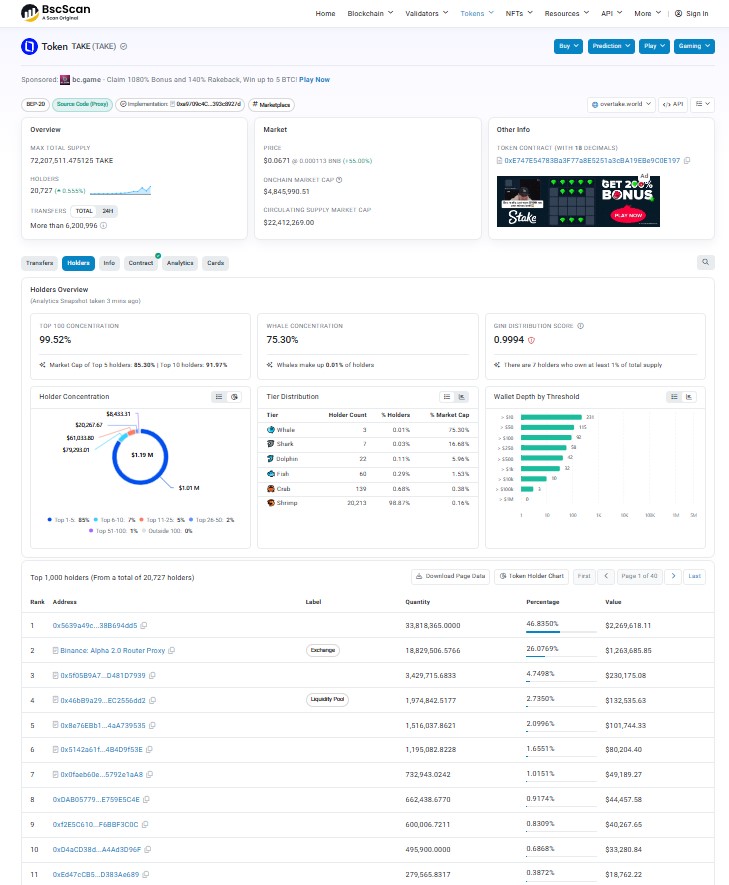
That's a real risk, and it's the same concern raised in the whale concentration analysis linked earlier. On the other hand, CertiK rates the contract at 4.3 out of 5, according to CoinMarketCap, which is a decent security signal for a smaller cap token.
OVERTAKE Technical Analysis: TAKE Rallies 83% on Breakout Volume
The move started with the AlphaX futures listing news and then accelerated once volume expanded. According to TradingView chart analysis, price broke clean above the multi-month range and is now trading well above its 20 EMA on both daily and weekly timeframes.
Daily Chart Structure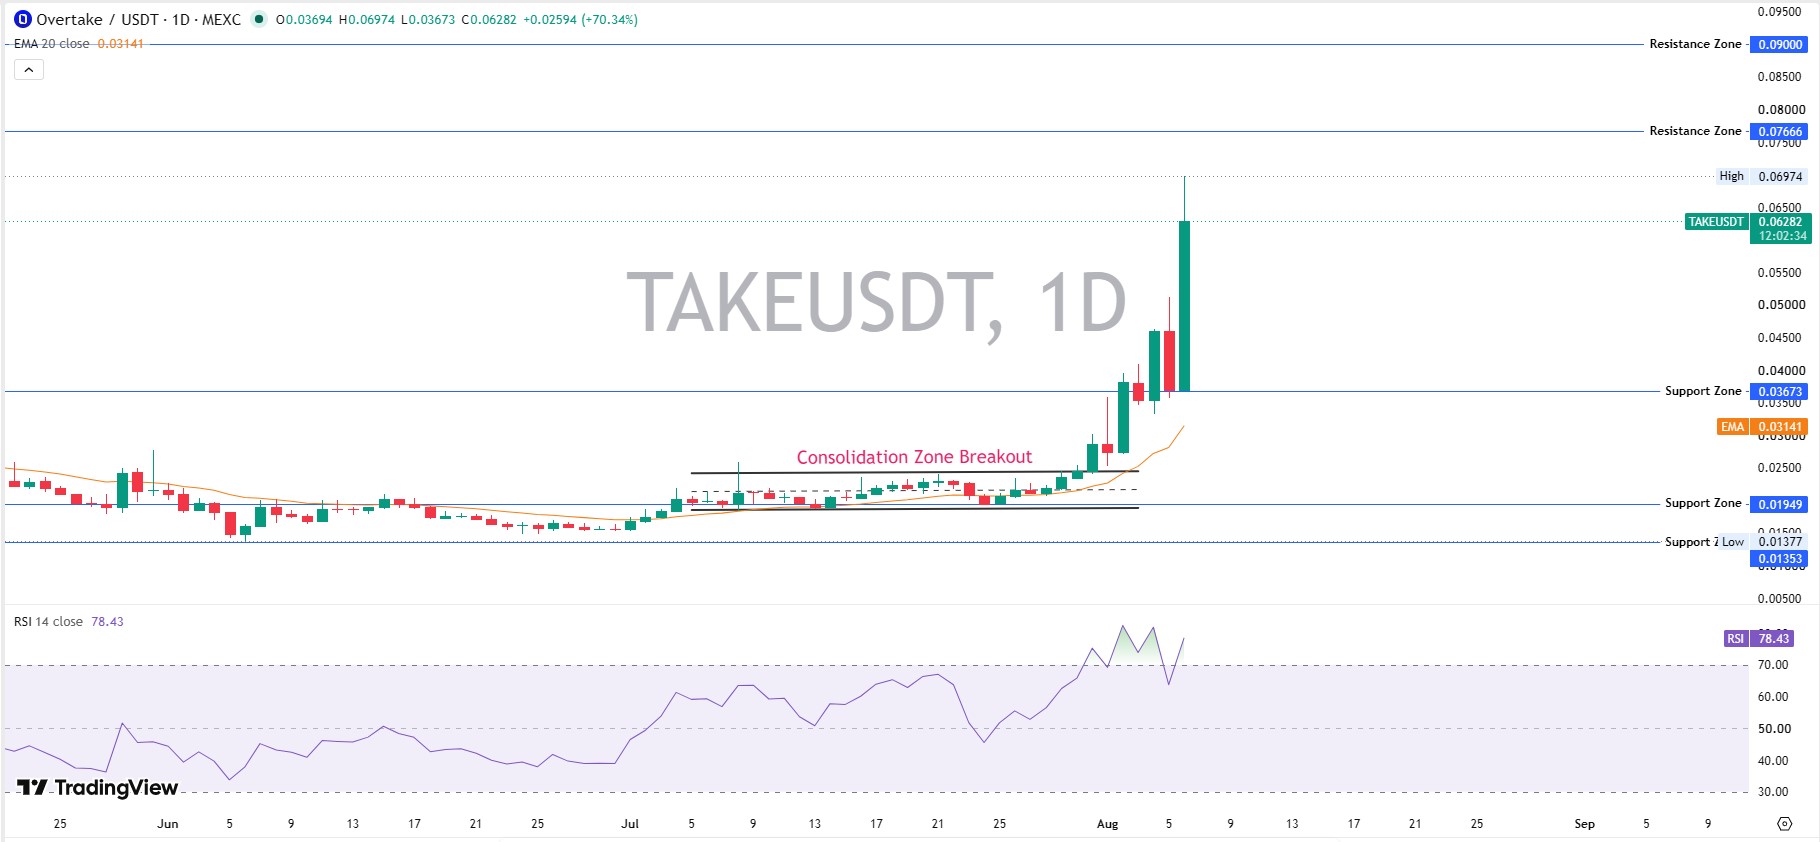
RSI on the daily sits at 78.43, deep in overbought territory, which usually means a pullback or consolidation zone breakout is due before a fresh leg higher.
Price is holding above the daily EMA20 of $0.03141, a bullish structural signal, after printing a high of $0.06974 against a low of $0.01377 over the period.
Key resistance sits at $0.07666 and then $0.09000. Key support sits at $0.03673, with a deeper floor near $0.01949.
Weekly Chart Structure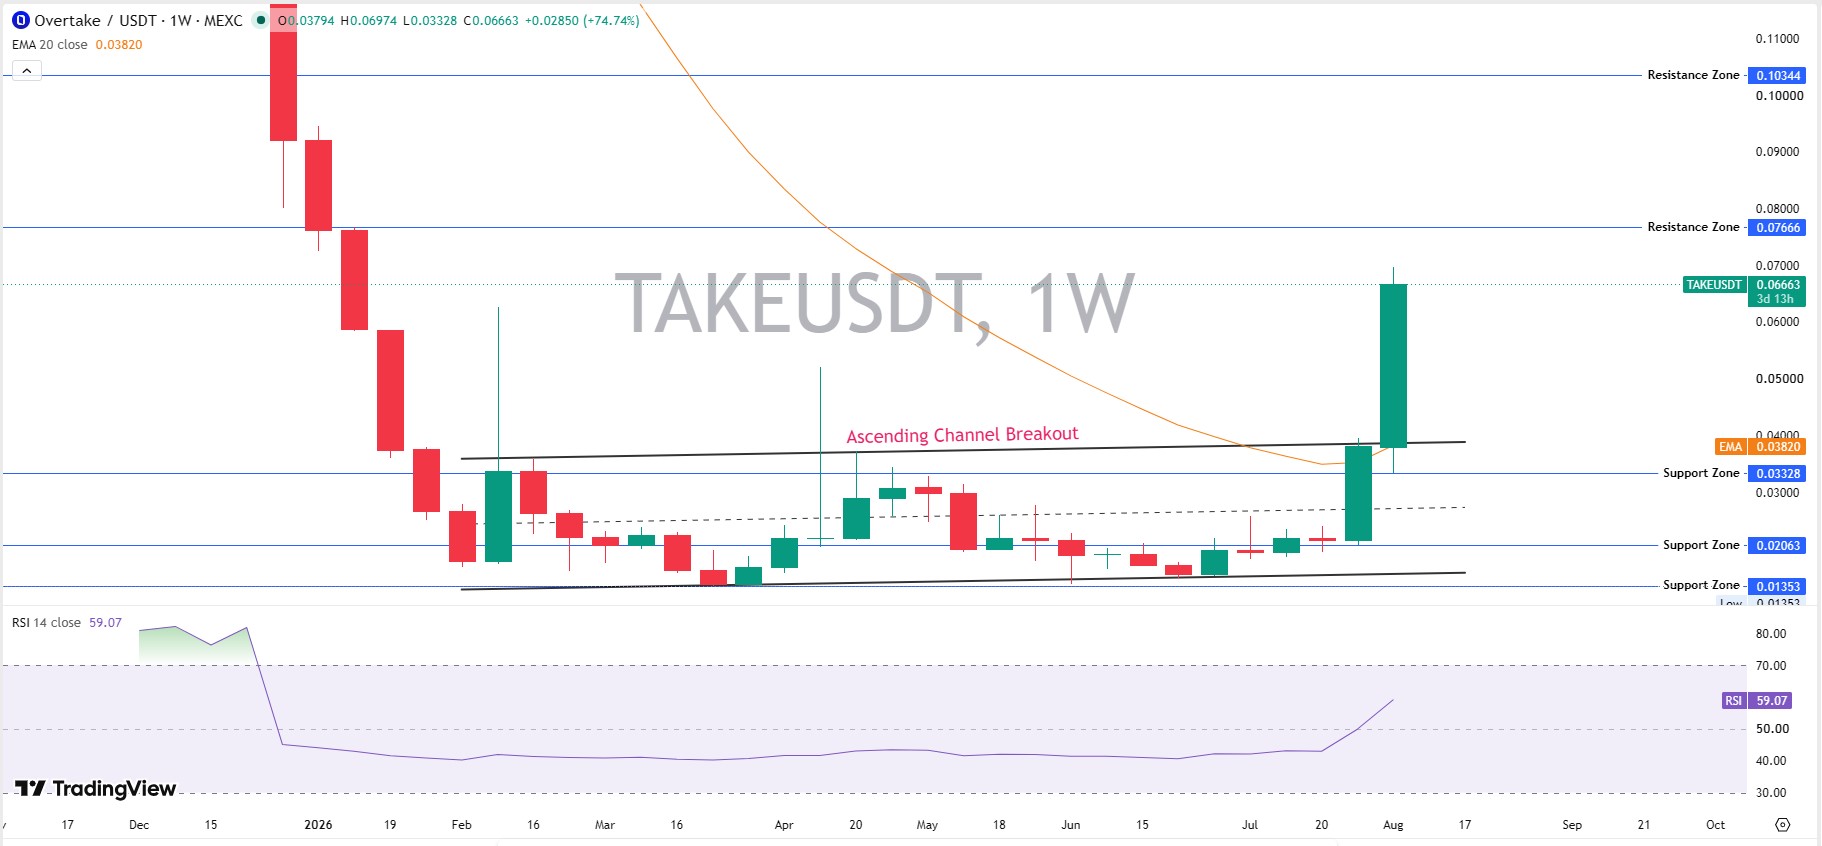
The weekly RSI at 59.07 still has room to run before hitting overbought territory, unlike the stretched daily reading.
Price is holding above the weekly EMA20 of $0.03820, and the chart shows a clean ascending channel breakout after months of coiling between rising trendlines.
Key resistance sits at $0.07666 and then $0.10344 on the weekly chart. Key support sits at $0.03328, backed by deeper zones at $0.02063 and $0.01353.
OVERTAKE Volume Heatmap Shows Where the Real Liquidity Sits
According to CoinGlass, Binance leads all venues with $31.16M in volume, followed by LBank at $11.69M and BingX at $7.62M. Bitunix, Gate, and MEXC round out the smaller share.
Short-Term OVERTAKE Price Prediction: What Next Few Weeks Could Bring
The short-term picture depends heavily on whether TAKE can hold above its breakout zone without giving it all back.
Timeframe | Support Zone | Base Zone | Resistance Zone | Invalidation |
24 Hours | $0.0328 | $0.0674 – $0.0700 | $0.0800 | Break below $0.0367 |
3-7 Days | $0.0290 | $0.0674 – $0.0700 | $0.0950 | Lose $0.0333 |
2-4 Weeks | $0.0180 | $0.0767 – $0.0850 | $0.1100 | Weekly close below $0.0206 |
Watch that $0.0367 support closely, because losing it undoes most of this week's breakout.
Long-Term OVERTAKE Price Forecast: Where TAKE Could Head Into 2027
Zooming out, the long-term case rests on whether Overtake keeps landing exchange listings and whether its gaming marketplace actually pulls in users, not just traders. For traders benchmarking multi-year levels, the long-term outlook piece digs deeper into the 2026-2030 scenarios.
Timeframe | Support Zone | Base Zone | Resistance Zone | Catalyst Needed |
3 Months | $0.0180 | $0.0500 | $0.1200 | Hold weekly support and rising volume |
6 Months | $0.0100 | $0.1000 | $0.1800 | Ecosystem growth and sustained demand |
End of Year | $0.0100 | $0.2500 | $0.3500 | Break above major weekly resistance |
2027 Outlook | $0.0120 | $0.4000 | $0.5500 | New ATH, adoption and crypto bull market |
The long-term case is real but not guaranteed. It needs sustained volume, not just one news-driven spike. Keep an eye on the coin events calendar for any scheduled catalysts that could shift this outlook.
Three OVERTAKE Price Scenarios Traders Should Prepare For
Worst Case: A broad market pullback combined with whale selling drags TAKE back under $0.0367 and toward $0.02.
Base Case: Price consolidates between $0.045 and $0.08 while the market digests this week's move.
Best Case: A fresh listing or partnership pushes volume higher again and TAKE clears $0.09 resistance.
Scenario | Price Range | What Triggers It |
Worst Case | $0.018 to $0.033 | Broad sell-off, whale distribution |
Base Case | $0.045 to $0.080 | Sideways digestion after the spike |
Best Case | $0.090 to $0.130 | New listings, sustained volume growth |
Key OVERTAKE Price Levels Every Trader Should Be Watching
Resistance zone: $0.07666, and above that, $0.09000, both from the daily chart structure.
Support zone: $0.03673 on the daily, backed by $0.03328 on the weekly.
Invalidation zone: A weekly close under $0.02063 would break the ascending structure entirely. For live movement on this and other tokens, the crypto news feed updates through the session.
OVERTAKE Analyst View and Final Thoughts on the TAKE Rally
When we pulled up the daily chart, the first thing that stood out was how thin the pullback candles looked compared to the breakout candle itself. That's a sign buyers stepped in fast.
RSI at 79.93 is stretched, and stretched RSI readings this high rarely go straight up from here. Some cooling off looks likely.
A weekly close above the $0.0382 EMA would keep the bullish structure intact and confirm this was not just a one-day pump.
Beyond the chart, the one thing worth tracking is whether more exchanges follow AlphaX and list TAKE derivatives, since that tends to keep volume elevated. Broader listing trends across the space are tracked in the memecoin news section as well.
The most important level right now is $0.0367. Hold it, and the breakout stays alive.
Lose it, and this starts looking like a fakeout.
Risk Factors Behind This OVERTAKE Price Move
Liquidity risk: Whale concentration is extreme at 75.30%, per BscScan, which can cause sharp drops on any large sale.
Volatility risk: RSI above 79 on the daily raises odds of a fast pullback.
Thesis breaker: A weekly close below $0.0206 would undo the ascending channel breakout entirely.
For a wider view of where altcoins sit against majors right now, the full price prediction hub covers forecasts across the market.
Disclaimer: This article is for educational purposes only and does not constitute financial advice. Crypto markets are volatile. Consult your investment advisor before making any investment decision.