OVERTAKE Price Prediction 2026: Can $TAKE Hit the $0.10 Level?


A commerce-focused token most people had not glanced at in weeks just ripped higher, and the reason has nothing to do with a celebrity tweet or a coordinated pump. Wallets moved first, then the chart confirmed it, then the volume followed right behind. Is this the early leg of a real trend change or another sharp bounce that fades once the excitement wears off? This OVERTAKE price prediction breaks down what the daily setup, the weekly structure, and the wallet concentration data are actually saying.
Table of Contents
Why TAKE Is Moving Today
TAKE Technical Analysis: Daily Chart
TAKE Technical Analysis: Weekly Chart
TAKE Support And Resistance Levels
OVERTAKE Price Prediction: Scenarios By Timeframe
TAKE Tokenomics And Whale Concentration
Liquidations And Exchange Volume
TAKE And The Digital-Commerce Altcoin Narrative
TAKE Market Outlook: Risks To Watch
Key Takeaways
Key Takeaways
TAKE trades near $0.0383, up over 35% in 24 hours per CoinMarketCap, still down more than 92% from its December 2025 all-time high.
Daily RSI sits near 82.53, deep in overbought territory, while weekly RSI reads a neutral 50.16.
Top 5 wallets hold 85.30% of tracked supply. That's the number to watch.
Invalidation for the bullish case sits under $0.0272 on the daily chart.
Why TAKE Just Woke Up After Weeks Of Quiet Trading
This OVERTAKE price prediction matters right now because $TAKE trades near $0.0383 after jumping more than 35% in twenty-four hours, per CoinMarketCap. The daily chart had quietly been building an ascending channel since early July, and TAKE just cleared the top of it on a single green candle.
Volume told the same story. It climbed alongside the breakout, and the move lines up with a broader stretch of altcoin risk appetite returning, not unlike the setup covered in the altcoin rally breakdown on GIGGLE and SOON, though TAKE's trigger traces back to its own chart.
Turns out, thin order books can turn a good move into a wild one fast. Anyone tracking where new $TAKE pairs go live should keep an eye on an exchange listing tracker before assuming liquidity is deep everywhere.
TAKE Technical Analysis: Daily Chart
On the daily TradingView chart, $TAKE is trading near $0.03825, up from an open of $0.03794, inside a clean ascending channel that traces back to early July.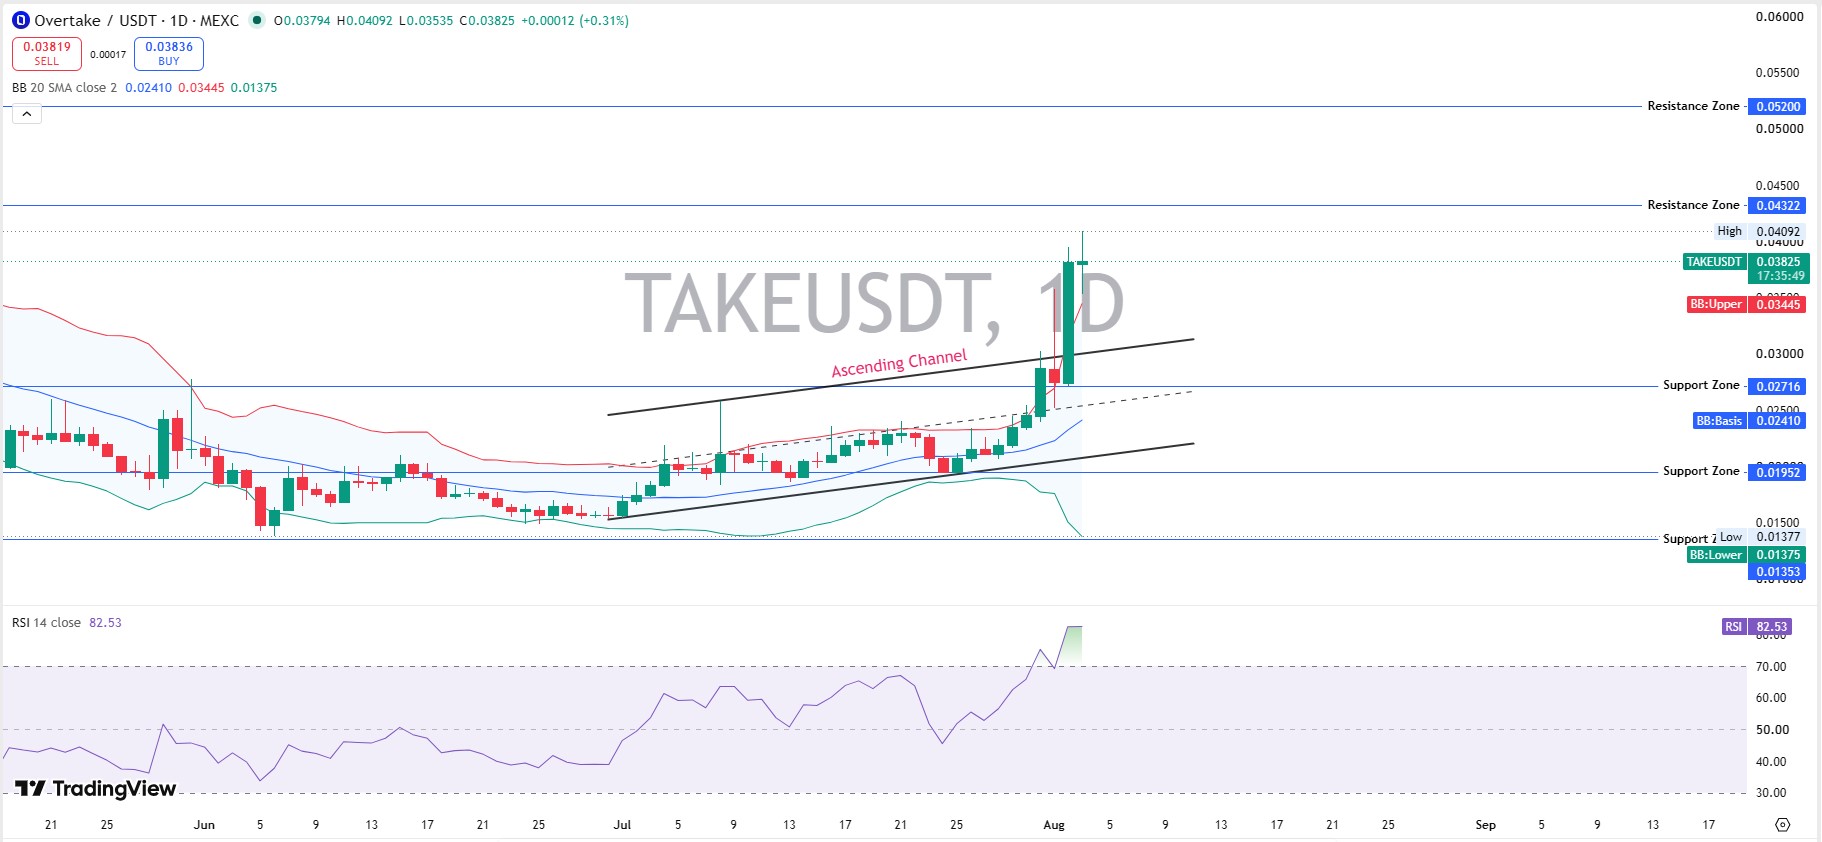
Resistance stacks first at $0.04322, then $0.05200. Support sits at $0.02716, then $0.01952, with a deeper floor near $0.01377.
Daily RSI reads 82.53. That is deep, overbought territory. When we pulled up the chart, the RSI print stood out more than the candle itself, because a reading this hot rarely holds without a pullback first.
A daily close above $0.04322 would confirm the channel is extending. Losing $0.02716 fast would flip that read.
TAKE Technical Analysis: Weekly Chart
Zoom out and the weekly chart tells a rounded-bottom story. $TAKE spent months carving out a bowl shape between roughly $0.014 and $0.03, and this week's candle pushed the price above the bowl's rim.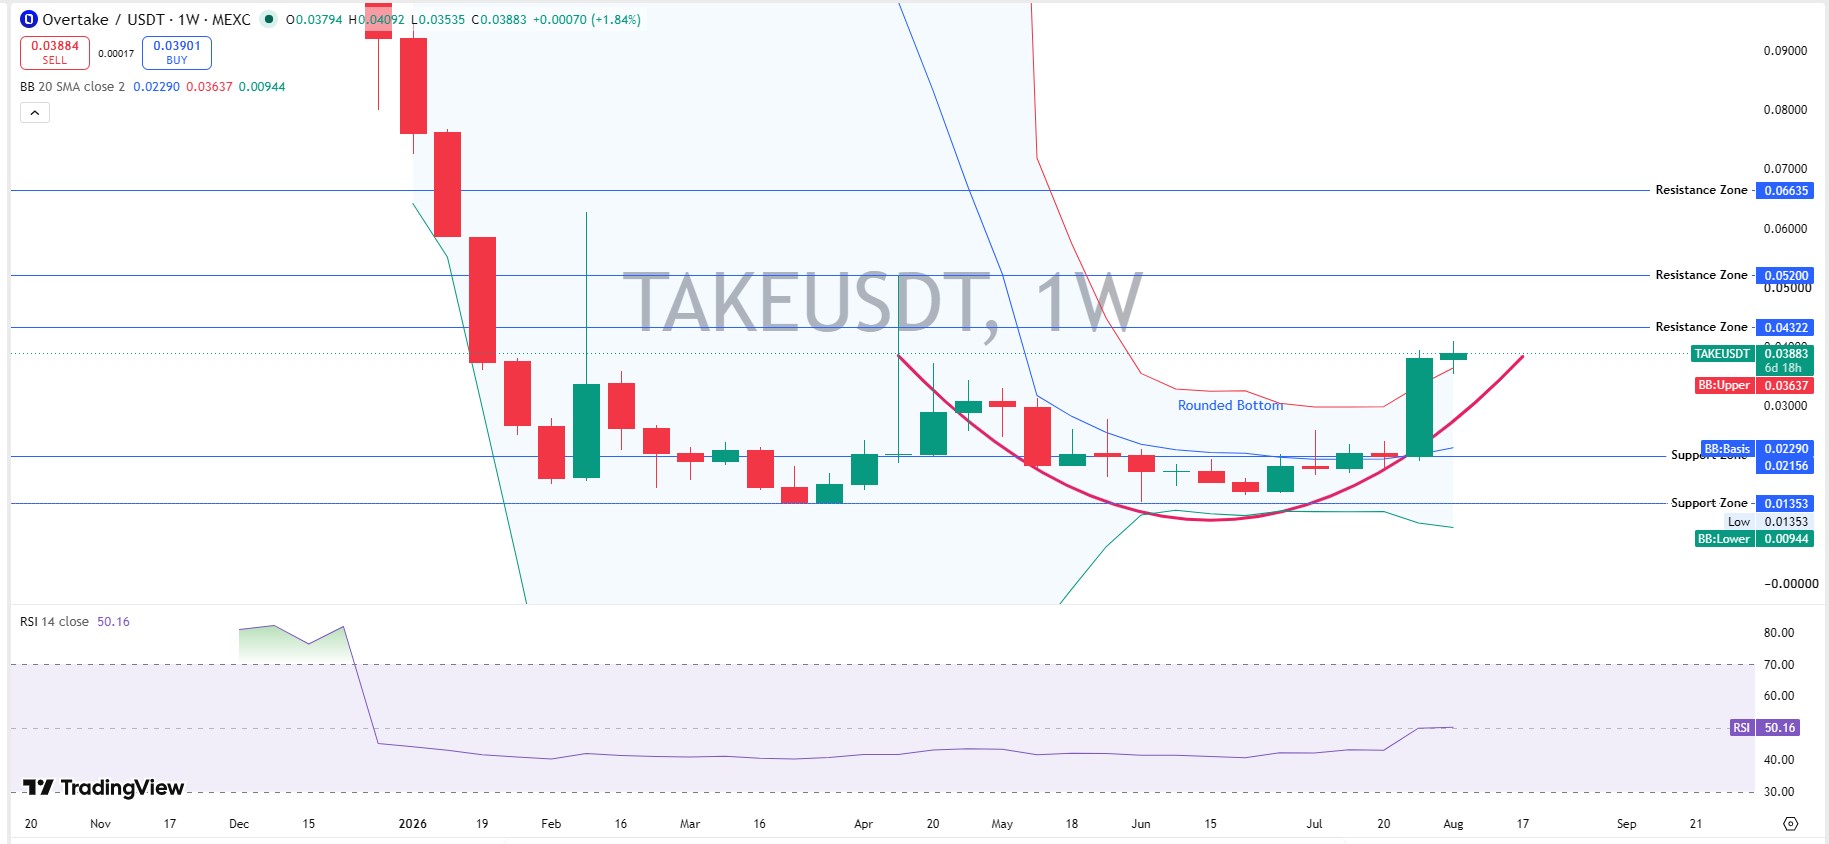
Weekly resistance sits at $0.04322, then $0.05200, then $0.06635. Support runs near $0.02156, backed by a deeper zone at $0.01353.
Weekly RSI reads 50.16, still neutral. Here's the thing: a rounded bottom breaking out on rising RSI from neutral, not overbought, tends to carry more follow-through than a spike from an already-hot daily chart.
A weekly close above $0.05200 would be the first real signal this base is resolving upward for good.
TAKE Support And Resistance Levels
Immediate support: $0.02716, then $0.01952, then $0.01377.
Immediate resistance: $0.04322, then $0.05200, then $0.06635.
A weekly close above $0.05200 would confirm the breakout has legs.
OVERTAKE Price Prediction: Scenarios By Timeframe
Timeframe | Bull Case | Base Case | Bear Case |
24H | Holds above $0.038, tests $0.0432 (moderate) | Chops between $0.033-$0.040 (high) | Slips under $0.0272 (low) |
7D | A weekly close above $0.052 opens $0.066 (low-moderate) | Range-bound under channel resistance (high) | A daily close under $0.0272 confirms fade (moderate) |
Aug 2026 | The channel extends and targets $0.06-$0.10 (low-moderate) | Drifts $0.025-$0.045 tracking altcoin flows (moderate) | Breaks $0.0136 ATL zone (low) |
Invalidation for the bullish $TAKE price prediction is a daily close under $0.0272.
TAKE Tokenomics And Whale Concentration
Total supply sits at 1,000,000,000 TAKE. The circulating supply reads 332.57M TAKE, giving a market cap near $12.72M and an FDV near $38.27M, per CoinMarketCap. Liquidity-to-market-cap runs near 2.82%, and volume-to-market-cap sits at 20.49%.
The distribution and vesting schedule splits supply across Community Reward (30%, 60-month linear), Ecosystem and Liquidity (17.5%, 48-month linear), Core Contributors (16%, 12-month cliff), Investors (15%, 6-month cliff), Marketing (8%), Airdrops (7.5% combined), and Exchanges (6%, unlocked at TGE).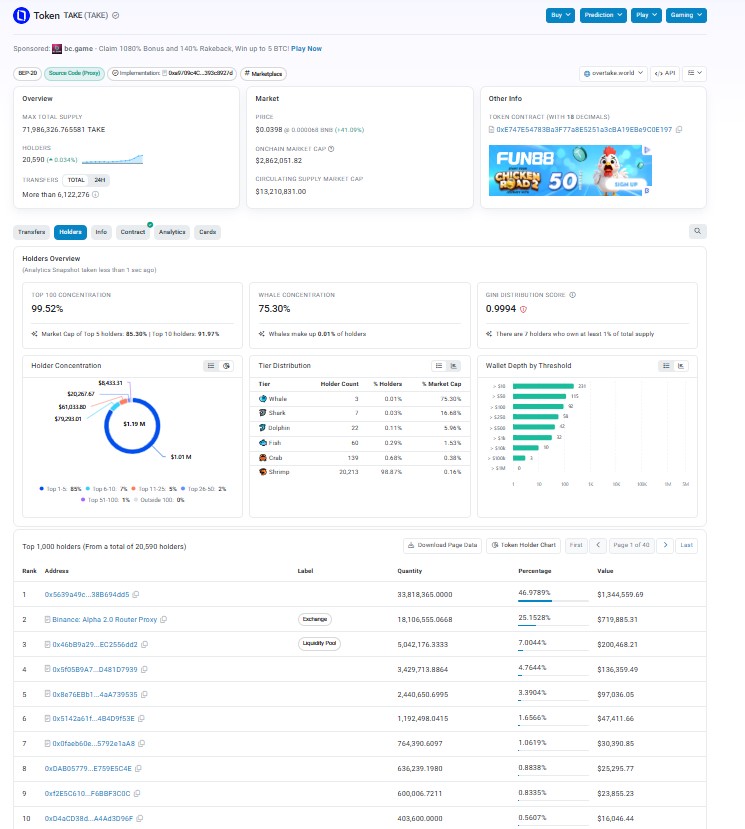
On-chain, concentration runs extremely heavy. Top 100 wallets hold 99.52% of tracked supply, and the top wallet holders list shows the top 5 alone controlling 85.30%. The Gini distribution score reads 0.9994, about as skewed as it gets.
A single wallet holds roughly 46.98% of tracked supply, worth near $1.34M, with the Binance Alpha 2.0 router proxy holding another 25.15%. That fact alone should shape how anyone reads this OVERTAKE price prediction.
Tier | Holder Count | % Holders | % Market Cap |
Whale | 3 | 0.01% | 75.30% |
Shark | 7 | 0.03% | 16.68% |
Dolphin | 22 | 0.11% | 5.96% |
Fish | 60 | 0.29% | 1.53% |
Crab | 139 | 0.68% | 0.38% |
Shrimp | 20,213 | 98.87% | 0.16% |
Liquidations And Exchange Volume
Per CoinGlass liquidation data, 24-hour liquidations hit $84.62K, split between $28.64K in longs and $55.98K in shorts. Shorts took the bigger hit today.
Binance carries the heaviest spot and futures volume at $26.46M, with LBank close behind near $11.75M and BingX around $6.98M. Bitunix, MEXC, and Gate trade with smaller slices.
Fine. That's a real derivative interest for a token this size, and it's worth checking against a major like Bitcoin, whose own setup gets covered on the Bitcoin 2026 outlook page.
TAKE And The Digital-Commerce Altcoin Narrative
TAKE is not a meme chart chasing attention. It sits inside a digital-commerce and creator-rewards narrative, where buyers, sellers, developers, and evangelists earn from a shared token pool.
That framing tends to pull in fresh buyers whenever altcoin risk appetite improves broadly. And a 35% daily move on a sub-$15M market cap does not automatically mean the trend has turned for good.
This is exactly why the OVERTAKE price prediction 2026 keyword search keeps climbing alongside broader $TAKE crypto price prediction coverage. Demand for the story is outrunning the market cap right now.
TAKE Market Outlook: Risks To Watch
Whale concentration tops the list here, and it's not a small risk. One wallet near 47% of the supply can move the price on its own, no warning needed.
A break below $0.0272 would put TAKE back on track toward its all-time low near $0.01363, set on March 30, 2026. That's a real possibility, not a scare tactic.
Macro matters too. A softer Fed rate decision tends to lift risk appetite across small-cap altcoins broadly, $TAKE included.
Staying on top of headline risk matters as much as the chart does. Ongoing coverage on the latest crypto news tends to flag catalysts before they hit price.
Digital-commerce tokens also tend to cluster with reward campaigns and new listings. It's worth a glance at crypto airdrop trackers before assuming this move stands alone.
Also worth checking is a coin events calendar for anything scheduled around TAKE this month.
Anyone comparing TAKE against other 2026 setups can browse the full price prediction hub for context on how this move stacks up.
Methodology
Chart levels came from TAKE/USDT daily and weekly charts on MEXC via TradingView, using RSI-14 and 20-period Bollinger Bands, captured on August 3, 2026, around 14:00 UTC. Price, supply, and market-cap data came from CoinMarketCap, also captured on August 3, 2026, around 14:00 UTC. Holder and Gini concentration data came from on-chain wallet tracking on BscScan for contract 0xE747E54783Ba3F77a8E5251a3cBA19EBe9C0E197. Liquidation and volume figures came from CoinGlass.
Disclaimer
This is speculative market commentary, not financial or investment advice. Crypto assets are volatile and can lose most or all of their value. Verify live figures before trading.


















