Pare Price Prediction: What Comes After PARE’s 157% Surge?


This PARE price prediction covers the breakout above $0.0191 with a 152% single-day spike, fresh off a new all-time high near $0.02395. Backed by real trading volume and a live buy and burn mechanism, this Robinhood Chain token is testing every level traders watch. See where support, resistance, and the 2026 to 2030 targets stand, plus the level that would flip this bearish.
Where PARE Is Trading Right Now
PARE is changing hands around $0.01913, according to live PARE price data on CoinGecko.
That is a 24-hour jump of roughly 152%. Not a typo.
The token printed a fresh all-time high near $0.02395 on September 7, then pulled back toward current levels.
24-hour trading volume sits near $8.61 million across tracked markets. A move without volume behind it would fade fast. This one has not, at least not yet.
PARE trades on Robinhood Chain, tied to a tokenized stock protocol pulling in fresh eyes this week.
Why Is PARE Price Rising Today?
a breakout, backed by real volume, inside a thin market.
PARE has a circulating supply of 1 billion tokens and a market cap of roughly $19.35 million. That is small.
Small cap plus sudden volume equals sharp candles. That is just math.
But there is a protocol story underneath too. The project describes four live stock series and says protocol fees are designed to buy and burn PARE whenever a split happens.
Liquidity across the main pools looks tight but active, and you can check the live PARE liquidity pool chart for pool depth. That liquidity is why this rally held instead of collapsing.
Sentiment has flipped bullish too, and series launches tend to line up with real catalysts, so it is worth keeping the crypto events calendar open while this plays out.
PARE's Tokenized Stock Narrative
Here is the mechanic. PARE protocol splits a Robinhood stock token into two pieces.
One piece is the principal token, which trades at a discount and redeems the underlying stock at maturity. The other is the yield token, which captures every dividend paid before that date.
Buy the stock without the dividends. Or buy only the dividends. Two very different trades, one asset.
The team has also been building leveraged loops, auto-rolls, and multi-stock dividend baskets on top of these two halves.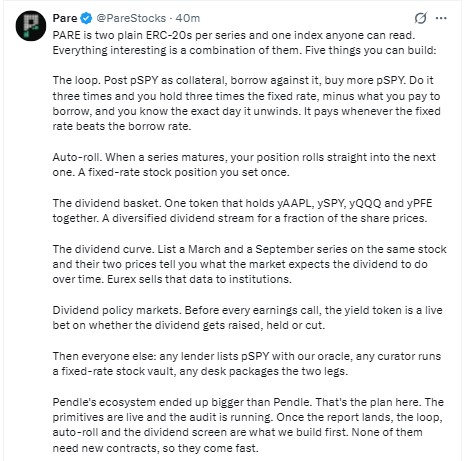
The protocol currently supports series tied to AAPL, SPY, QQQ, and PFE, per the official PARE announcement on X.
Is Volume Confirming the Rally?
When we pulled the trading data, what stood out first was how much daily volume grew alongside the price move. That is confirmation, not noise.
Compare that to the token's all-time low of $0.001768, hit on September 4. PARE is now sitting roughly 10 times above that low.
Volume spikes like this show up a lot in fast-moving corners of the market, the kind of pattern we track in our memecoin market news coverage too.
PARE Price Prediction for the Next 7 Days
This table reads the current chart structure. It is not pulled from an algorithm, and it is not a guarantee.
Scenario | Target | Trigger |
Bullish | $0.0248 to $0.039 | Trading pushes above the $0.02395 ATH into the 1.0 to 1.618 Fibonacci zone |
Base | $0.0142 to $0.02395 | PARE holds above the 20 EMA and consolidates below the ATH |
Bearish | $0.0076 to $0.0102 | Breaks the 20 EMA support zone on falling volume |
If you are tracking multiple setups this week, the price prediction hub covers more coins going through the same kind of move.
PARE Technical Analysis and Key Price Levels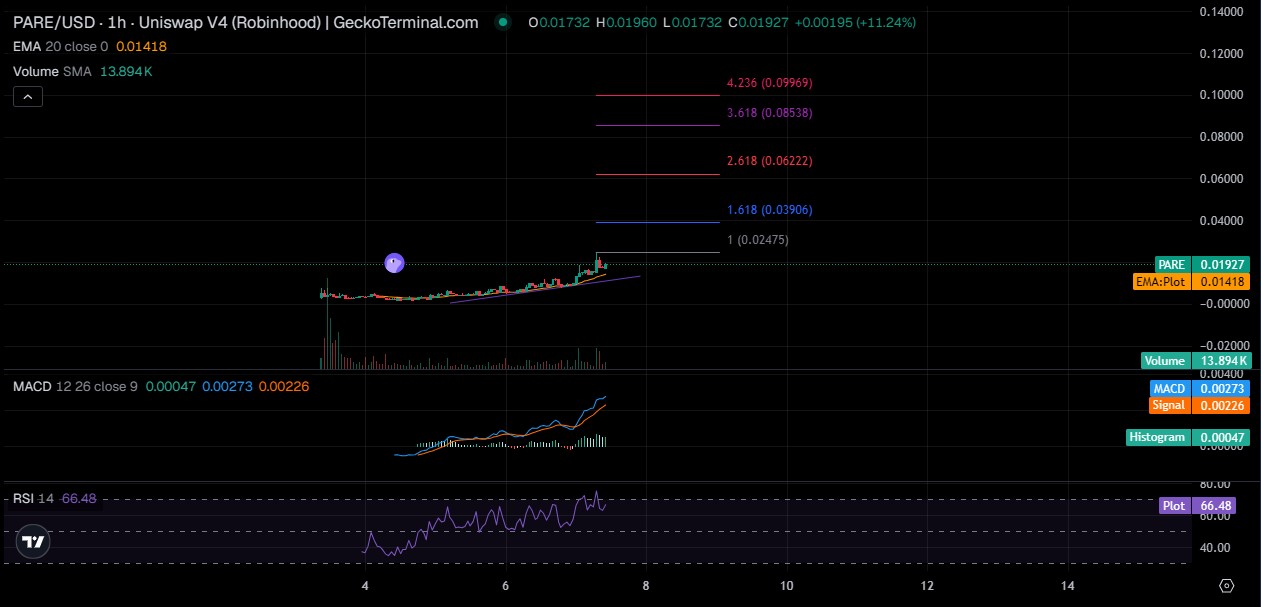
This technical chart analysis maps where PARE sits after its breakout, reading trading range, momentum, and volume together, so you can judge if this move still has room to run.
PARE Support Levels
Immediate support sits near $0.0173, where the latest breakout candle opened.
Breakout support lands near $0.0142, right at the 20-period EMA tracking beneath trading.
Deeper support sits at the old all-time high near $0.0102, a level that flips from resistance to support if trading holds above it. The major invalidation point is the 24-hour low near $0.0076. A trade down through the all-time low of $0.001768 would undo the entire recovery.
PARE Resistance Levels
The current ATH near $0.02395 is the first wall.
Above that, the 1.0 Fibonacci extension near $0.0248 lines up with the recent peak. The 1.618 extension near $0.039 and the 2.618 extension near $0.0622 mark the next liquidity zones if momentum carries through.
RSI and Momentum
The 14-period RSI on the hourly chart reads 66.48, firmly bullish and nearing overbought without tipping fully into it.
The MACD line sits above its signal line with a positive histogram. That is a bullish setup, not a warning sign, at least for now.
But a 152% single-day move usually stretches short-term momentum regardless of what any indicator says. Chasing the top of this candle carries real risk.
Volume and Breakout Confirmation
Volume rose before price accelerated, not after. That ordering matters. It suggests real buyers stepped in first, rather than a thin wick with nothing behind it.
PARE Bull, Base and Bear Price Scenarios
Scenario | Target | Conditions |
Bull Case | $0.039 to $0.062 | Clean breakout above ATH, volume holds above $8M daily, lending unlock lands |
Base Case | $0.0142 to $0.02395 | Price consolidates above the 20 EMA, volume cools toward $4M to $6M |
Bear Case | $0.0076 to $0.0102 | Breakout fails, volume dries up, broader market turns risk off |
Invalidation | Below $0.001768 | A daily trading close under the all time low erases the recovery thesis |
PARE Price Prediction 2026
A 4-day old token, four live stock series, and a buy and burn design tied to protocol usage.
If adoption keeps growing through 2026, a base case range of $0.015 to $0.03 looks reasonable, with market cap climbing toward $25 million to $30 million on unchanged supply.
A bull run tied to new series, a lending unlock, or a wider chain rally could push PARE toward $0.04 to $0.06. A bear case, tied to liquidity drying up, could see it fall back to $0.005 to $0.008.
PARE Price Prediction 2027-2030
Long range numbers on a token this young carry heavy uncertainty. Treat this table as directional, not precise.
Year | Bear Case | Base Case | Bull Case |
2027 | $0.004 | $0.020 | $0.060 |
2028 | $0.003 | $0.030 | $0.090 |
2029 | $0.002 | $0.040 | $0.120 |
2030 | $0.0015 | $0.050 | $0.160 |
What Could Drive PARE Price Higher?
PARE Buy and Burn Mechanism
Protocol fees from every split are designed to market buy and burn PARE. Usage shrinks supply, at least in theory. No staking, no emissions diluting holders.
The team has also confirmed Pashov Audit Group as its auditor, with the full report due once it lands. You can verify the contract yourself through the verified PARE contract on Blockscout before trusting any of this on faith.
Robinhood Chain Growth
More chain activity does not automatically mean more PARE demand. But it usually helps liquidity, and liquidity is what let today's rally hold shape.
Chain narratives shift fast right now, similar to what shows up in our AI crypto news coverage, and PARE could ride that same wave of attention.
New Stock Series and Protocol Adoption
Four series are live today: AAPL, SPY, QQQ, and PFE. Add lending integration through Morpho, and each new series is a fresh burn trigger if usage follows.
The PFE series shows why the split matters. Pfizer pays roughly 43 cents a quarter on a $25 share, splitting it into a near-zero coupon principal token and a leveraged dividend token, a trade retail could never access before. The project's public deck projects protocol fees from roughly $236,000 a year up to $43 million by year three, based on rates already live on this one chain.
Watch the project's own exchange listing tracker for signs of wider distribution beyond the current three exchanges.
What Could Send PARE Price Lower?
A failed breakout above the ATH is risk number one. Price could snap back into the range it just left.
Liquidity is thinner than headline volume suggests. A market cap near $19 million means a handful of large sells can still move price a lot.
Holder concentration is real, but not all of it is a typical whale risk. The top 10 wallets hold about 25.57% of supply, though the largest single wallet is a locked liquidity contract, not a free-floating holder.
Broader crypto weakness would not help either. If Bitcoin or Ethereum rolls over, small-cap tokens fall harder and faster.
Execution risk sits underneath everything too. The Pashov Audit Group review is confirmed but still running, and contracts stay locked until that report is public.
PARE Price Prediction: Key Levels Traders Should Watch
Level | Why It Matters | Bullish/Bearish |
$0.02395 (ATH) | Breakout confirmation zone | Bullish |
$0.0142 to $0.0173 | 20 EMA and breakout support | Bullish |
$0.0076 to $0.0102 | Old ATH turned support, pullback zone | Neutral |
$0.001768 (ATL) | Thesis invalidation | Bearish |
Is PARE a Good Investment in 2026?
Depends entirely on your risk tolerance, and we will say that plainly instead of hedging.
PARE is a sub $20 million token with real volume behind its move and a mechanism, buy and burn, that only works if usage grows. That is a bet on adoption, not a sure thing.
Worth noting: matching halves always merge back into the original stock, any time, no fee, giving the trade a defined worst case even if the token stays volatile.
If you are risk averse, this is not your trade. If you can stomach 50% swings in a day, it is at least interesting.
Some traders chase extra upside through our crypto airdrop list instead of the open market, worth a look if entry price is the concern.
Not investment advice, and nothing here should be treated as a signal to buy or sell.
Disclaimer
This article is for informational purposes only and does not constitute financial, investment, or trading advice. PARE is a low market cap, high volatility token, and prices can move sharply in either direction within minutes. All price levels, targets, and scenarios above reflect chart structure and public data at the time of writing, not a guarantee of future performance. Always do your own research, and consult a licensed financial advisor before making any investment decision.
Also read:

















