Pi Network Price Prediction: The Great Escape From Rock Bottom


Pi Network Price New High Coming From Rock Bottom
The escape attempt hit a wall today. After two consecutive green days that carried PI from Monday's all-time low of $0.070979 up toward $0.080, the token is pulling back again, down 5.20% in the past 24 hours to $0.07569.
But the chart structure underneath that pullback is genuinely more interesting than the daily percentage suggests
PI is now sitting almost exactly on a Murrey Math extreme-oversold level at $0.07324, right at the rising boundary of a triangle pattern technical analysts have been tracking since the ATL.
This piece works through what that specific setup means and why today's red candle doesn't necessarily undo the escape narrative.
PI trades at $0.07881 today, down 5.20% in 24 hours per OKX, pulling back from the two-day bounce that followed Monday's $0.070979 all-time low.
The pullback is landing almost exactly on a Murrey Math extreme-oversold level at $0.07324, which also sits close to the rising boundary of a triangle pattern on the daily chart,
a structure that offers a genuine technical case for support holding here rather than breaking down further.
Chaikin Money Flow remains negative near -0.20, meaning outflows still outweigh inflows even as buyers have defended recent lows.
The 20-day EMA near $0.1039 and the 50-day EMA near $0.1218 remain the levels that would actually confirm an escape.
Until either is reclaimed and held, today's pullback is a normal, even expected, part of testing whether rock bottom actually holds.
The Insider Data: Reading the Triangle and the Murrey Math Level Together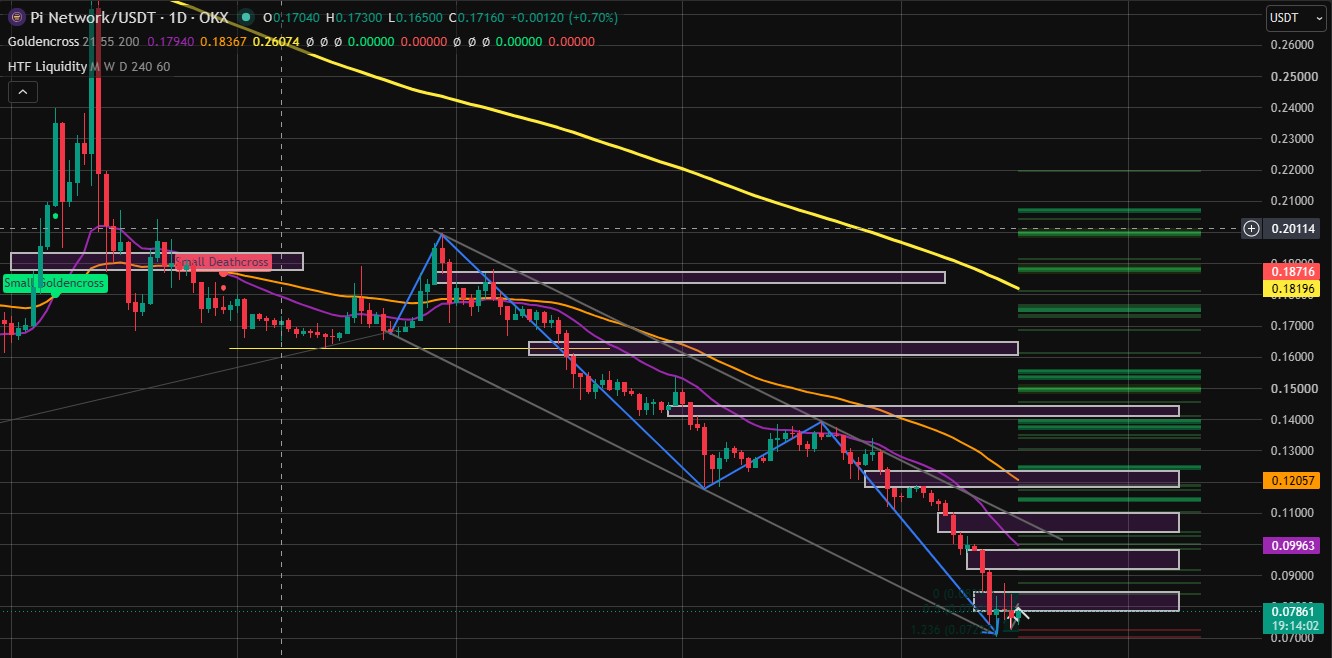
Technical Detail | What It Shows |
Current price | $0.7566-$0.07861 down 5.20% in 24 hours (OKX) |
Murrey Math extreme-oversold level | $0.07624 a level technical analysts flag as historically associated with exhausted selling pressure |
Triangle pattern rising boundary | Sits close to today's pullback zone, near $0.07324–$0.076 |
Chaikin Money Flow | -0.20, still net negative despite buyers defending recent lows |
All-time low | $0.070979, set July 14, 2026 |
Key resistance (20-day EMA) | $0.1039 |
Key resistance (50-day EMA) | $0.1218 |
Recent bounce range | $0.075–$0.076 low to roughly $0.080–$0.081 high over the past two days |
The reason this specific confluence, a Murrey Math extreme-oversold reading landing right at a rising triangle boundary, matters more than a simple percentage move is that it gives today's pullback a concrete level to hold rather than an open-ended drop.
If $0.07624 holds through today's selling, it would mark the second time in four days PI has defended a specific, named technical level rather than simply drifting lower, a meaningfully different pattern than the free-fall structure that defined the first two weeks of July.
Why Today's Red Candle Doesn't Necessarily Break the Escape Narrative
Every genuine bottoming process includes pullbacks that retest the low without breaking it; that's a normal feature of price discovery after a sharp decline, not a contradiction of a recovery attempt.
What would actually undo the 'great escape' framing is a decisive close below $0.070979, the all-time low itself, on rising volume.
A pullback that holds above $0.07624, even after two strong up days, is consistent with a market testing its own conviction rather than one that's abandoned the recovery attempt entirely.
The persistent negative Chaikin Money Flow is the honest counterweight here.
It shows that even during Tuesday and Wednesday's gains, more capital left the token than entered it on a rolling basis, a pattern more consistent with short covering than fresh accumulation.
A genuine escape from rock bottom would eventually need that reading to turn positive, and it hasn't yet.
Quick Facts: Pi Network
Metric | Current Reading |
Current Price | $0.7566-$0.07861 (OKX) |
24h Change | -5.20% |
All-Time Low (July 14) | $0.070979 |
Murrey Math Extreme-Oversold Level | $0.07624 |
Chaikin Money Flow | -0.20 |
Key Resistance | 20-day EMA $0.1039, 50-day EMA $0.1218 |
Market Cap | $828 million |
Pending Unlock | Remainder of the 127.5 million PI July unlock, ongoing |
X (Twitter) Sentiment
Pi Network has introduced a redesigned mining app interface, making it easier for users to navigate the growing Pi ecosystem.

The latest update refreshes the side menu and profile page, helping Pioneers quickly access essential features like App Studio, Launchpad, KYC, Mining Dashboard, and Security settings.
This UI upgrade marks another step in Pi Network's broader effort to improve user experience and prepare the ecosystem for future expansion.
Technical Analysis 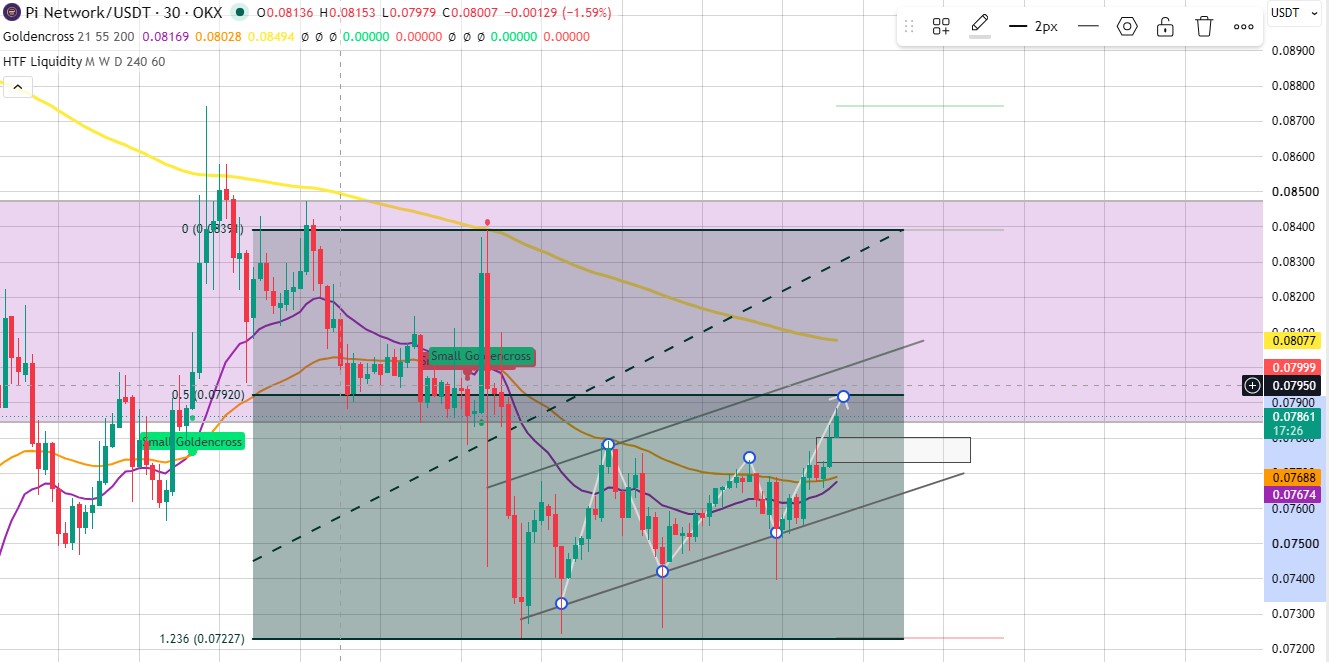
Indicator | Current Reading | Signal |
24h price change | -5.20% | Pullback after a two-day bounce, testing key technical support |
Murrey Math level | $0.07624 | Historically associated with exhausted selling; a hold here would be constructive |
Chart pattern | Rising triangle, boundary being tested today | Needs to hold to keep the reversal case alive |
Chaikin Money Flow | -0.20 | Still net negative; genuine accumulation not yet confirmed |
Price vs. EMAs (20/50/100/200) | Below all four | Broader trend remains bearish regardless of today's specific test |
Pi Network Price Prediction: Bear, Base, Bull, and Extreme Bull Scenarios
Scenario | Next 30 Days | End of 2026 | Key Condition |
Bear Case | $0.055–$0.070 | $0.05–$0.08 | $0.070979 all-time low breaks decisively on rising volume |
Base Case | $0.072–$0.095 | $0.08–$0.13 | $0.07324 holds; range-bound trading continues below the 20-day EMA |
Bull Case | $0.10–$0.13 | $0.13–$0.19 | 20-day EMA ($0.1039) reclaimed and held; Chaikin Money Flow turns positive |
Extreme Bull | $0.14+ | $0.20–$0.30 | 50-day EMA reclaimed, PiVerify adoption accelerates, broader altcoin sentiment recovers |
Risk & Opportunity
Risks | Opportunities |
Chaikin Money Flow remains negative, suggesting today's bounce lacked genuine accumulation behind it | The $0.07881 Murrey Math level and the rising triangle boundary are converging at almost the same price, a real technical confluence |
A decisive break below $0.070979 would reopen entirely uncharted downside territory | PI has now defended a specific technical level twice within four days, a different pattern than the earlier free-fall |
127.5 million PI unlock supply continues entering circulation regardless of today's technical setup | Two consecutive green days before today's pullback was the longest bounce streak of the month |
Price remains below all major moving averages, keeping the dominant trend technically bearish | A hold at today's key level would mark the second defended support test since the ATL |
















