Polygon Price Prediction August 2026: Expert Outlook


Polygon swapped its old MATIC ticker for POL a while back, part of a bigger plan to become the layer that connects a whole group of Ethereum scaling chains instead of running just one. Good context, but not really today's story.
This polygon price prediction august 2026 is about where the price actually sits right now: $0.07166, down 2.31% over the last day, with the daily and weekly charts pointing in two different directions at once.
Polygon Price Today: Live Data and 24-Hour Change
$POL is sitting at $0.07166 , down 2.31% today.
Market cap is $765.85M, also down 2.3%, and 24-hour trading volume is $36.21M, down a steeper 11.28%. 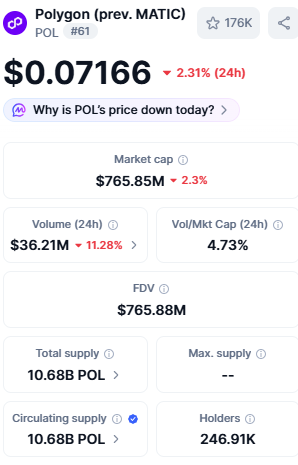
Source: $POl Market Cap Data Taken From Networkmarketcap, data as of July 29, 2026. Figures may vary slightly across other tracking websites.
Do the math on those two and you get a volume-to-market-cap ratio of 4.73%, which is a fair amount of activity for a Network this size.
Fully diluted valuation is $765.88M, barely above the market cap, because circulating supply and total supply are basically the same number: 10.68B POL. No max supply is listed either.
In plain terms, almost every token that will ever exist is already out there, so there's no big unlock cliff waiting to hit this chart later. The holder count is 246.91K addresses.
Technical Analysis: Key Support and Resistance Levels (Polygon)
Daily Chart Analysis of Polygon.
Look at the daily chart , and $POL is riding inside an ascending channel.
Break above the top of it, and resistance sits at $0.08542, then $0.09500, then $0.10496. 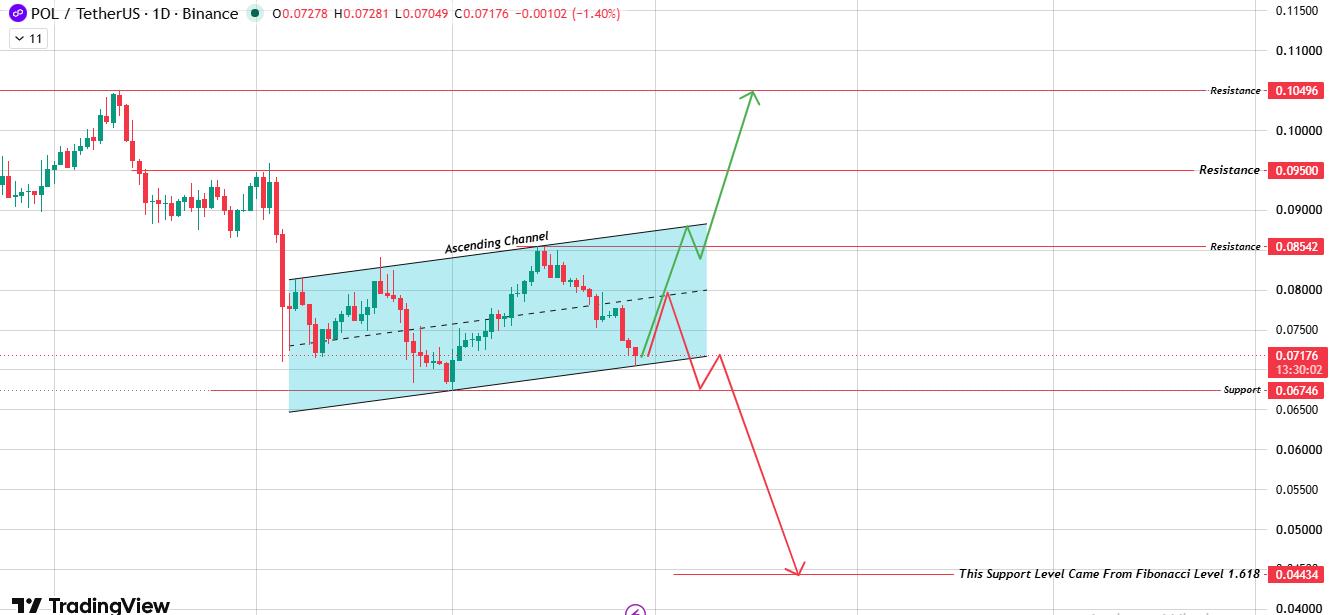
Source: Chart Taken From TradingView.
Break below the bottom instead, and the price probably drops to $0.06746, with $0.04434 as a much deeper worst-case level, coming from the Fibonacci 1.618 extension.
Weekly Chart Analysis for Polygon Price Prediction August 2026
The weekly chart tells the opposite story: a descending channel that's been running for weeks.
Break above it, and resistance runs through $0.09486, $0.10486, and $0.11909. 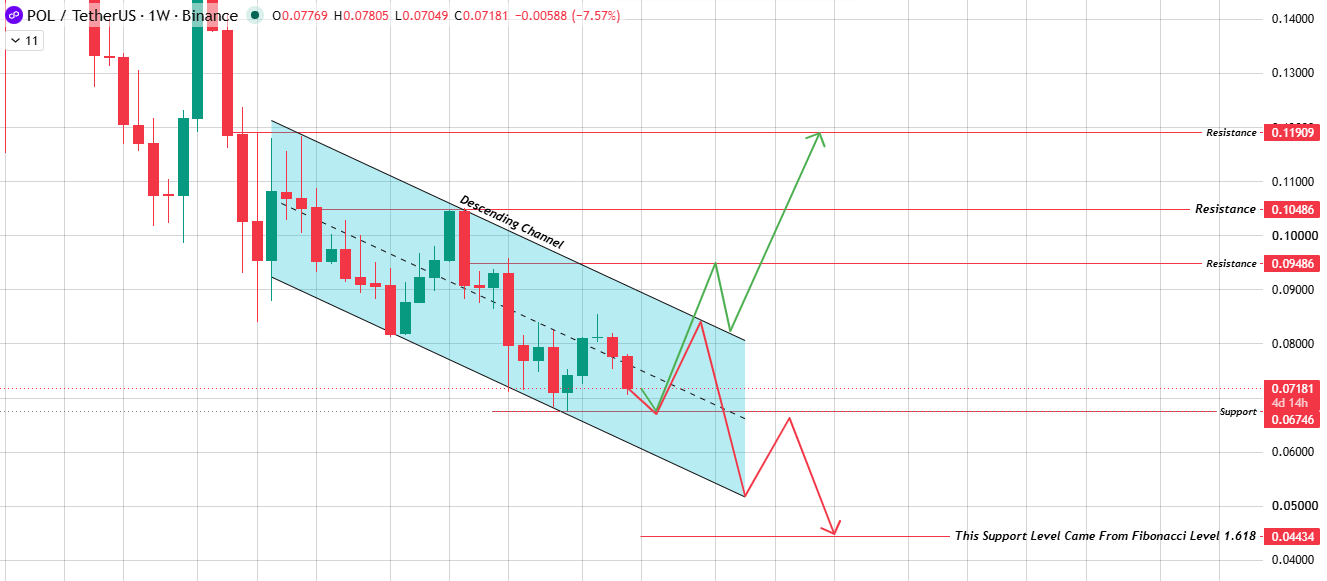
Source: Chart Taken From TradingView.
Break below it, and the price likely heads right back to that same $0.06746 support, with $0.04434 again marking the extreme downside.
Whatever else changes, $0.06746 is the one number both timeframes keep pointing to.
Polygon Price Prediction for August 2026: Bull, Base, and Bear Cases
Here's the tricky part of this polygon price prediction august 2026: the daily chart shows an ascending channel, which usually means up, while the weekly chart shows a descending channel, which usually means down.
Both are real, both are active right now, and which one wins out decides where $POL goes this month.
| Scenario | August 2026 Target | Invalidation Level |
|---|---|---|
| Bull | $0.08542 – $0.10496 | Rejection at the channel boundary or daily close below $0.06746 |
| Base | $0.06746 – $0.08542 (Range-Bound) | Confirmed close outside either boundary |
| Bear | $0.06746 – $0.04434 | Break and hold below $0.06746 |
Bulls need $POL to hold the bottom of that daily ascending channel and punch through the top of it. Do that, and $0.08542 is first up, then $0.09500, then $0.10496.
The base case is the boring one: price just keeps bouncing around inside the channel without breaking either way.
Bears take over the moment $0.06746 gives out, since that's a level both charts agree on.
On-Chain and Fundamental Drivers (Polygon)
Since circulating supply and total supply are nearly identical, $POL doesn't have the token-unlock problem that hangs over a lot of altNetworks.
What is worth watching is that volume dropped over 11% in the last day, faster than price did, which hints that trading interest has cooled off a bit alongside the pullback.
On the plus side, close to 247K holders suggests the token isn't sitting in just a few big wallets.
August 2026 Catalysts That Could Move Polygon
The biggest Polygon-specific story going into August is AggLayer, the project's effort to connect liquidity across multiple chains instead of keeping it stuck on one network.
Real-world asset tokenization built on top of Polygon is another thing worth tracking.
Outside of that, broader altNetwork liquidity and swings in BitNetwork dominance will probably matter just as much as anything happening on Polygon itself.
What Analysts Are Forecasting (Polygon)
Right now, the charts genuinely disagree with each other. Daily says up, weekly says down, and that's not something to smooth over; it's the actual setup.
Sentiment stays cautiously positive as long as $0.06746 holds and turns more cautious the moment it doesn't.
This is chart-and-data analysis, not personal financial advice, and crypto markets are volatile enough that past patterns are no promise of what happens next.
Polygon Long-Term Outlook: 2027 to 2030
If $0.06746 holds through the rest of 2026, a slow climb toward $0.10496 and even $0.11909 looks reasonable across 2027 and 2028, going by how both channels have moved so far.
What $POL is actually worth by 2030 probably comes down to how far AggLayer gets adopted and whether real-world assets keep building on Polygon, more than any single level on this chart.
Risks That Could Invalidate This Forecast
The big one is a confirmed break below $0.06746, the support both charts share, which would open the door to $0.04434 in a worse-case scenario.
On the flip side, a pickup in volume and money flowing back into layer-2 tokens generally could push $POL through resistance faster than the bull case above expects.
How to Buy and Store Polygon Safely
POL is available on most major exchanges, usually paired with USDT, USD, or BTC.
With volume down lately, it's worth double-checking liquidity before placing a bigger order.
A hardware wallet makes sense for holding long-term, while a software wallet works fine for smaller amounts you trade more often.
Glossary
A few terms that keep coming up in this piece, explained simply.
An ascending channel is just two lines running upward, side by side, with the price bouncing between them.
A descending channel is the same idea, pointing down instead.
Support is a price area where buyers have stepped in before and slowed a drop, while resistance is the opposite, a spot that's turned back rallies in the past.
Disclaimer: This Polygon price prediction is for informational and educational purposes only and should not be considered financial or investment advice. Cryptocurrency markets are highly volatile, and prices can change rapidly. Always conduct your own research and consult a qualified financial advisor before making any investment decisions.









.jpg)








