Polygon Price Prediction: Breakout or Fakeout?


Polygon (POL) has just broken free of the descending channel that weighed on it for weeks, and the token is now testing a resistance zone that will decide whether this move has real legs.
This Polygon price prediction breaks down the breakout, the derivatives backdrop, and the levels that matter most from here.
Polygon (POL) Awakens – What Just Happened?
POL is trading at $0.07956, up 5.85% over the last 24 hours. Market cap data shows the figure at $851.21M, also up 5.86%, while 24-hour volume has surged 222.73% to $78.48M alongside the move.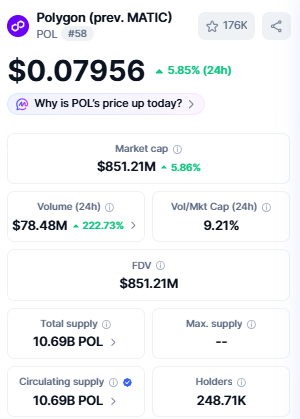
The token's fully diluted valuation matches its market cap at $851.21M, since all 10.69B POL are already in circulation with no fixed max supply, and the holder base stands at 248.71K.
The move comes after POL spent recent sessions bleeding below the $0.08 mark while buyers waited on the sidelines, making this bounce a notable shift in tone.
What Are Futures Traders Signalling?
Futures volume is led by LBank at $33.47M, followed by Binance ($29.12M), BingX ($8.96M), Bybit ($9.88M), and OKX ($6.77M), with WhiteBIT, MEXC, Bitunix, Bitget, KuCoin, Hyperliquid, and Kraken making up the rest.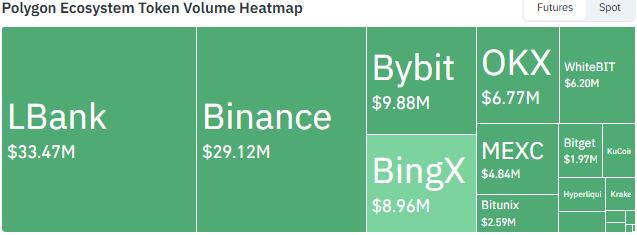
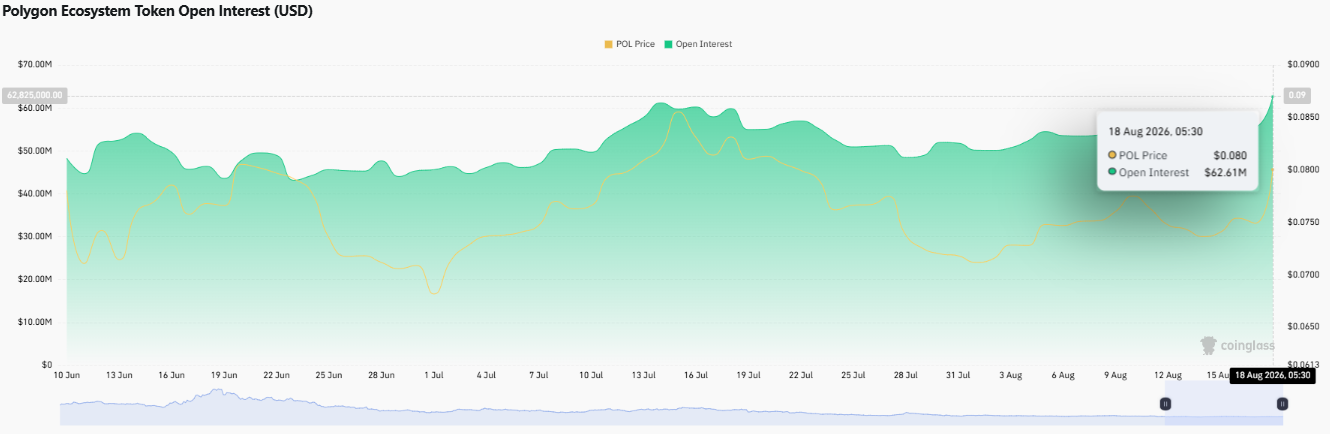
As per Coinglass data, open interest has climbed to $62.61M as of 18 August 2026, near the upper end of a range that has mostly held between $40M and $58M since mid-June.
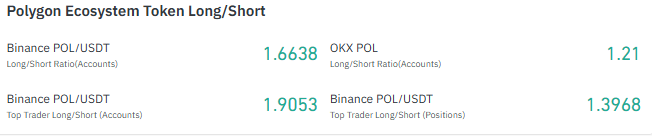
Positioning leans long across the board. Binance's account-based long/short ratio sits at 1.6638, and OKX runs lower but still long-leaning at 1.21. Binance's top trader accounts show an even stronger 1.9053 ratio, while the position-weighted long/short ratio for top traders comes in at 1.3968, showing a consistent long bias whether measured by account count or position size.
Liquidations tell a mixed story across timeframes. The 24-hour total reached $176.24K, with $127.99K from short positions against $48.25K in longs, consistent with the breakout squeezing shorts.
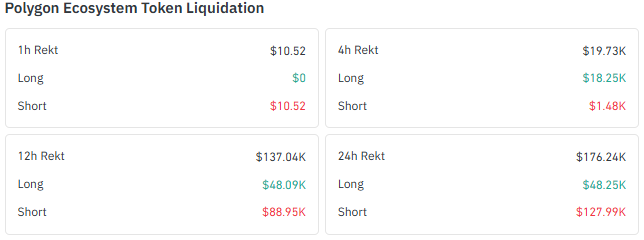
The 12-hour window shows a similar short-heavy split, though the 4-hour window flipped toward longs, a sign the move has had some back and forth along the way.
Polygon Technical Analysis: Breakout Meets Resistance
As per the TradingView chart, Polygon has just delivered a breakout from the descending channel that had capped price through the summer, and the token is now pressing into resistance near $0.08511.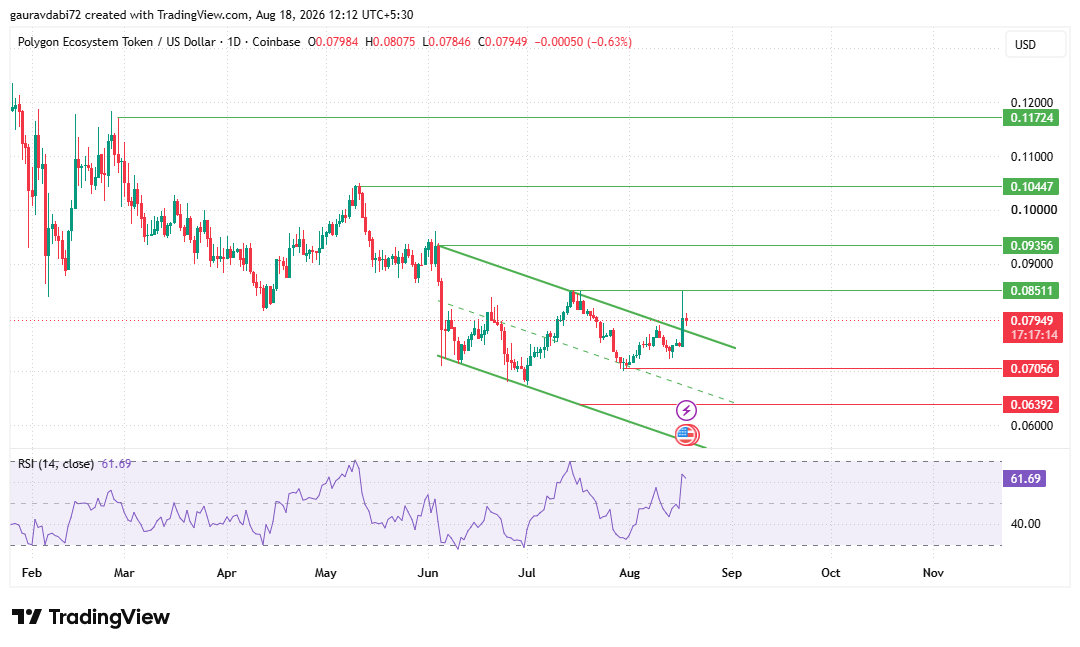
Breaking a channel of this length is meaningful on its own, but the real test starts here, since $0.08511 is exactly the kind of level where earlier rallies have stalled.
If POL can clear and hold above this zone, the path opens toward $0.09356, then $0.10447, and eventually $0.11724 further out.
None of these are guaranteed stops, since each one represents a fresh point where sellers have shown up before, but a sustained move above $0.08511 would be the clearest signal yet that the tone of this chart is shifting.
The other side of the equation matters just as much. If buyers can't hold the line here, support sits at $0.07056, with $0.06392 as the deeper level if that first floor gives way.
A breakout that fails to hold often ends up back near the level it started from, so how POL behaves around $0.08511 over the next few sessions will do more to define the setup than the initial breakout candle itself.
RSI at 61.69 supports the idea that momentum has genuinely improved, without pushing into stretched territory.
That leaves some breathing room for the move to continue if buyers stay engaged. This kind of setup, a breakout testing resistance with RSI still short of overbought, is often the type of technical picture worth watching closely rather than chasing outright, a theme covered in earlier analysis of POL's next big move.
Polygon Price Prediction: Bull, Neutral and Bear Scenarios
Bullish Case | A sustained hold above $0.08511 could open the way toward $0.09356, then $0.10447, and eventually $0.11724 further out. |
Neutral Case | POL churns around the $0.08511 resistance zone while the market decides whether the breakout has real follow-through. |
Bearish Case | A failed breakout would put $0.07056 back in focus, with $0.06392 as the deeper support if selling pressure builds. |
How Has POL Performed Recently?
POL is up 0.21% over the past 4 hours and 5.74% over 24 hours, extending a 4.15% weekly gain.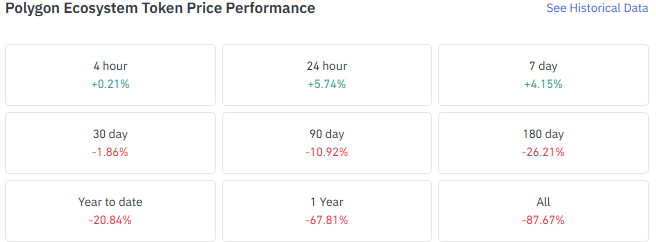
The 30-day figure is slightly negative at -1.86%, and the decline is steeper further out, with POL down 10.92% over 90 days and 26.21% over six months.
Longer term, the token is down 20.84% year to date, 67.81% over the past year, and 87.67% since inception, a backdrop covered in ongoing daily tracking of Polygon's price action.
What We're Watching Next
As per the CoinGabbar analyst, the breakout above the descending channel is the most notable development on POL's chart in weeks, and whether it holds through the $0.08511 resistance will shape the next leg.
Broader August 2026 coverage of Polygon has tracked this range for some time, and continued volume alongside price would go a long way toward confirming that this move has more than a single session behind it.
Disclaimer: This article is for informational purposes only and should not be considered financial or investment advice. Cryptocurrency markets are highly volatile, and prices can move sharply in either direction. Readers should conduct their own research and consult a qualified financial advisor before making any investment decisions.







.webp)








