Pump.fun Price Prediction 2026: Is a 110-Day Trap Forming?


Nobody was paying attention to Pump.fun last winter. Then quietly, almost silently, something started building. Not a breakout. Not a rally. Just accumulation.
The slow, grinding kind that most traders scroll past without a second glance. And now, 110 days into that base, the structure is coiled so tight that even skeptics are starting to look twice.
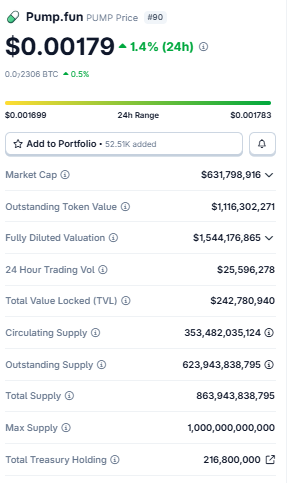
Pump.fun Price Prediction sits at $0.00179 today, up 1.4% in the last 24 hours with a range between $0.001699 and $0.001783.
Source: Data by CoinGecko
The market cap stands at $631.8 million and TVL at $242.8 million—not trivial numbers for a token that's been flying under the radar.
What's driving the current mood?
Partly a broader Bitcoin stabilization, partly renewed meme and launchpad token interest, and partly that six-bounce support zone that just refuses to break.
That's what makes 2026 interesting for $PUMP specifically: if the pattern holds, the next move isn't a small one.
Where Pump.fun Price Prediction Actually Stands Right Now
PUMP isn't in a great spot technically. But it's not broken either. It's sitting right at the edge of a decision zone that's been tested six times since January and held every single time. That's not noise. That's structure.
The support area between $0.001558 and $0.001645 has acted as a floor repeatedly over the past several months.
Price keeps dipping, retesting, and bouncing back above $0.001700. You can dismiss one bounce as luck. Two, maybe coincidence. Six? That's a market sending a message.
What Just Happened and Why It Matters
On May 22nd, a post from crypto analyst Don @DonWedge on X flagged something that 27,000+ impressions clearly agreed with: PUMP has been in accumulation for 110 days. Long bases, as any seasoned trader knows, tend to resolve with force in either direction.
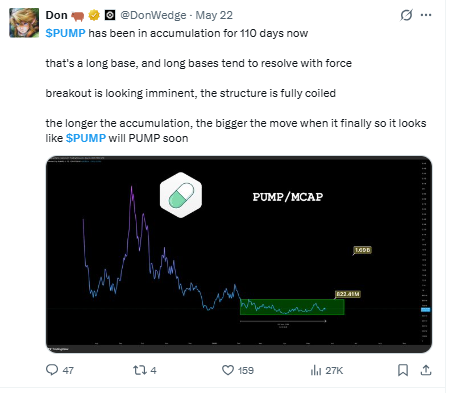
The structure is described as fully coiled. The PUMP/MCAP chart he shared shows the market cap compression tightening at levels that preceded the token's biggest historical moves.
That's one voice, sure. But it aligned with what the chart was already showing: a falling wedge pattern forming from December 2025 through now, with price making lower highs but the support zone refusing to give up ground.
And that raises a bigger question: one the market hasn't answered yet.
The Chart Has a Story. Most Are Reading It Wrong.
When we pulled up the daily chart on Binance, the first thing that stood out was the shape of the price action since December.
It's a classic falling wedge: lower highs in a converging channel, Pump.fun price prediction compressing toward the support zone.
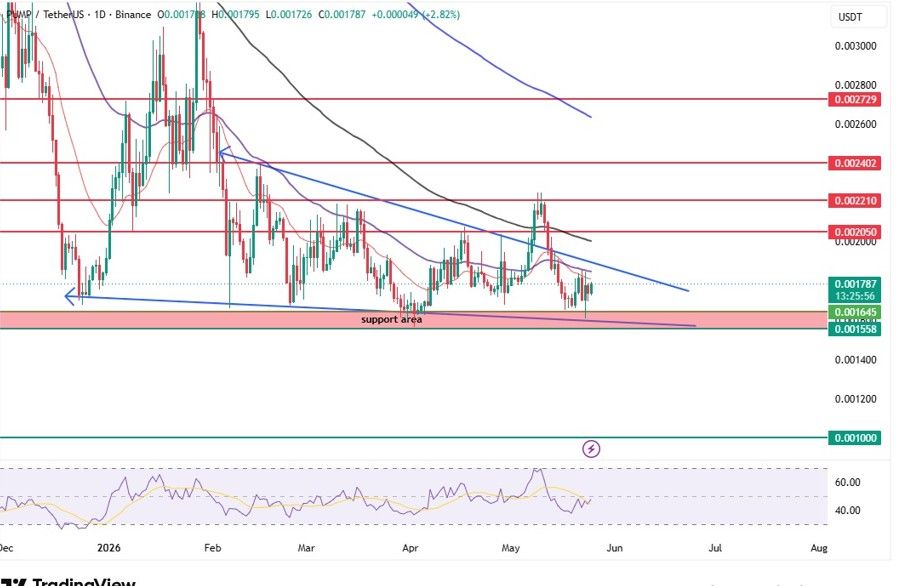
The wedge is tightening. That's actually encouraging: the longer the price compresses without breaking support, the more coiled the eventual move.
RSI is sitting around 45. That's not overbought, not oversold. It means this setup doesn't have momentum behind it yet.
But RSI at 45 on a falling wedge near tested support?
Last time PUMP hit similar RSI levels during a consolidation phase in late 2025, the price staged a 30%+ recovery before fading. That's not a guarantee, but it's context worth having.
The 20 EMA, 50 EMA, and 100 EMA are all sitting above the current price. That blue descending line visible on the chart is the 50 EMA acting as dynamic resistance.
Price tested it near $0.002210 in late April and got rejected hard. Bears are using it as a ceiling; bulls haven't been strong enough to push through.
Until that changes, this is a bearish chart with a bullish setup developing underneath it. Don't confuse the two.
Levels That Matter Right Now
Entry zone: $0.001699–$0.001800 That's essentially where the price is right now, inside the support area on a compressed falling wedge. Buying here means betting on the pattern.
Resistance targets if the wedge breaks upward:
First target: $0.002050–$0.002210 (20–25% upside)
Second target: $0.002402 (35%+ from current)
Extended target: $0.002729
If 2026 Plays Out the Way We Think
The setup looks more interesting than most are giving it credit for. Not because PUMP is some hidden gem with revolutionary fundamentals; it's a launchpad token, tied directly to the health of the meme coin ecosystem on Solana. But the structure is there.
If the falling wedge resolves bullishly and Bitcoin maintains its current consolidation zone through Q3 2026, PUMP could realistically test $0.002400 - $0.002700 by mid-year.
That's the Pump.fun price prediction for the optimistic 2026 scenario:
a range between $0.002200 and $0.002729, on a wedge breakout and continued Solana ecosystem activity.
The Case for Going Up
The falling wedge is a bullish reversal pattern. Six times on support-zone retests with no breakdown are structural evidence of strong buying pressure at current levels.
TVL of $242.8 million suggests real, locked capital, not just speculative float.
If the wedge breaks upward, the first measured target sits around $0.002050–$0.002210, a 15–23% move from current levels.
The Case for Caution
$PUMP is trading below the 20, 50, and 100 EMA. All three. That's bears in control, not just a minor pullback. Until price reclaims at least the 20 EMA, the macro trend remains down.
An RSI sitting around 45 isn't oversold. It's neutral-bearish, which means there's no technical urgency pushing a bounce right now.
Long accumulation periods can also resolve downward. If $0.001558 breaks on a daily close, this whole setup invalidates fast.
A circulating supply at 353 million out of a 1 trillion max supply means significant future dilution potential, a ceiling that macro investors tend to notice.
The Risk Nobody Wants to Talk About
Pump.fun price prediction: the entire business model depends on meme coin activity. When the meme cycle cools, and it always does, PUMP's fee revenue drops, and so does trader interest in the token.
We've already seen one version of that compression in this chart: the decline from peak levels in late 2025 to current prices.
And that's exactly the problem. Well, one of them. The other is regulatory.
A concentrated crackdown on permissionless token launchers, which has been discussed in both the US and EU regulatory circles, would directly impact pump.fun's core offering.
That's not priced in right now. It probably should be, at least partially.
A max supply of 1 trillion tokens with only 353 million circulating means supply pressure is real over the long term. Dilution is baked into the economics here.
Wrapping Up: Is Pump.fun Price Prediction Worth Watching in 2026?
The Pump.fun price prediction for 2026 sits in the range of $0.002200–$0.002729 in the bullish scenario, but that requires the falling wedge to break upward and hold.
The bearish invalidation is clean: a daily close below $0.001558 ends the setup.
What we're watching is a Pump.fun price prediction target price of 2026 that's achievable but not guaranteed. The accumulation is real.
The structure is there. But bears still control the trend, RSI is neutral, and the macro story needs to cooperate. Pump. Fun's market outlook for the next two quarters is cautiously bullish, with emphasis on "cautiously."
Pump. Fun technical analysis says wait for the breakout confirmation before chasing. But the setup? It's one of the more interesting ones in the mid-cap space right now.
DISCLAIMER: This article is for educational purposes only and does not constitute financial advice. Crypto markets are highly volatile. Before making any investment decisions, consult your investment advisor.
Also read:

















