Pump.fun Price Prediction: Can PUMP Confirm Its Breakout?


PUMP Breaks Higher, but Confirmation Is Still Missing
Pump.fun price prediction watchers have a genuinely open setup this week. The token is trading just above the top of its daily ascending channel, a level it has failed to hold cleanly before.
Price sits near $0.002953, up sharply over the past month, and the chart is now asking a simple question: Does this hold, or does it fade back inside the range it just left?
A breakout attempt is not the same as a breakout, and that distinction is the whole story right now.
Why Is PUMP Moving Right Now?
With no major fresh catalyst in focus, the move looks driven mostly by momentum and positioning rather than any single headline.
The token has climbed nearly 95% over the past month and more than 23% in the past week. and that kind of run tends to feed on itself.
Shorts caught in the move are being squeezed out while rising open interest shows fresh leveraged participation entering the market, pushing price into territory it has not tested in a while.
What Are PUMP Derivatives Showing?
Total liquidations over the past 24 hours came in near $917.51K, and short positions accounted for roughly $703.61K of that against about $213.89K on the long side.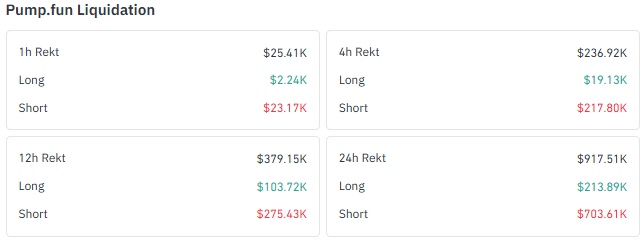
The imbalance shows up across shorter windows too, with the 4-hour and 12-hour readings both dominated by short-side liquidations. That pattern reads as a short squeeze rather than confirmation that the move has further to run.
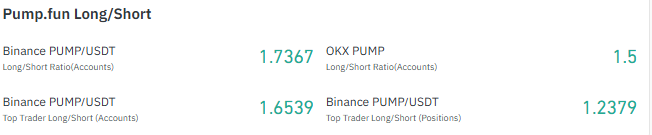
Positioning leans the same way. Binance's account ratio sits near 1.74 long to short, top trader accounts are close to 1.65, and OKX accounts show a similar lean at 1.5.
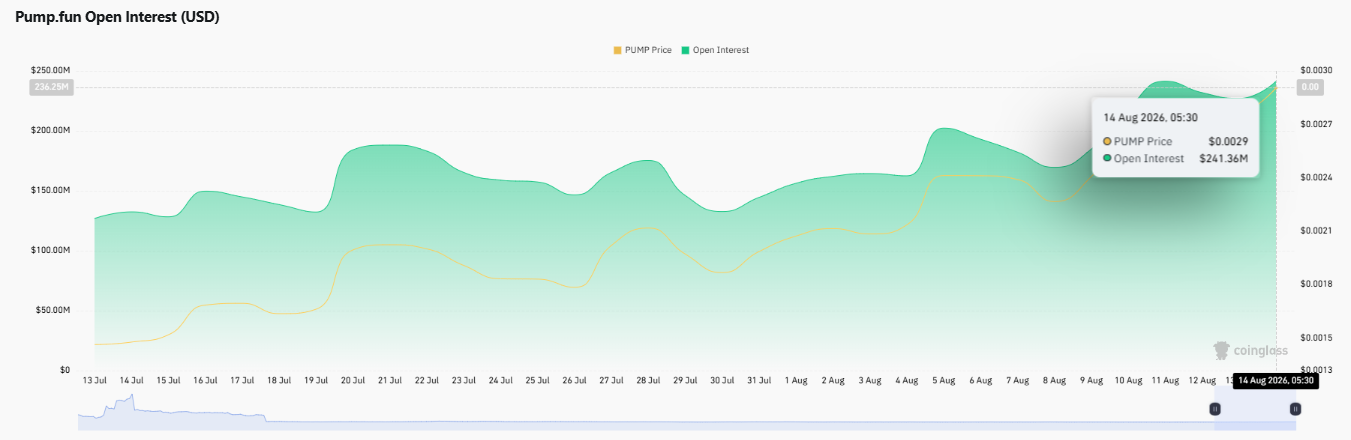
Open interest has climbed alongside the rally to roughly $241.36 million, a meaningful amount of leverage sitting behind a token trading near $0.0029. Rising open interest is not automatically bullish.
It mainly means more leveraged capital is active in both directions, which raises the odds of a sharper move once the market picks a side.
Data source: CoinGlass
How Has PUMP Performed Recently?
The token is up about 7.2% over the past 24 hours, 23.15% over the past week, and 94.42% over the past month, a run that explains why the chart is testing new resistance.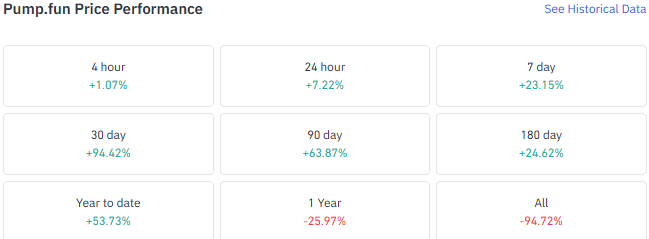
Zooming out, the year-to-date figure is up 53.73%, but the one-year change is still down close to 26%. Market cap has grown to around $1.15 billion, with 24-hour trading volume near $115.54 million, up close to 29% on the day.
Data source: CoinGlass
Can PUMP Hold Above Its Daily Ascending Channel?
The TradingView daily chart shows PUMP developing an ascending channel since its July recovery, and price is now pushing above the upper boundary of that structure for the first time in this leg.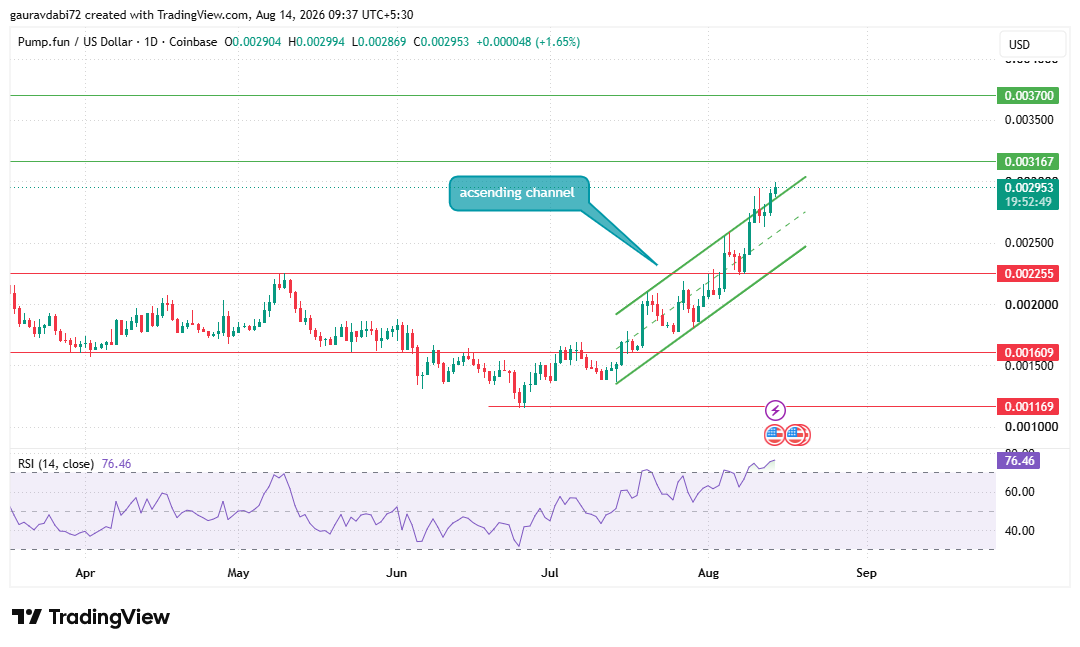
That qualifies as a breakout attempt, not a confirmed breakout. A single intraday push above resistance means little without a sustained daily close holding above the channel.
Momentum backs the move but comes with a warning attached. Daily RSI reads 76.46, firmly in overbought territory.
That does not mean price has to reverse here, but it does raise the importance of watching how the market behaves at resistance rather than assuming a straight extension higher.
If the breakout holds, the first resistance to watch sits at $0.003167, with $0.003700 coming into view if buyers stay in control beyond that.
Losing the reclaimed channel and slipping back inside it would be the first warning sign of a failed breakout. Below that, $0.002255 stands as the first major horizontal support, with $0.001609 as a deeper level if selling pressure builds.
A move toward $0.001169 would only become relevant after considerably more structural damage, not as an immediate downside scenario from here.
Data source: TradingView
Pump.fun Price Prediction: Two Scenarios Worth Watching
Scenario | What It Looks Like |
Continuation Case | A sustained daily close holds above the channel, opening the path toward the $0.003167 resistance area first and $0.003700 if buyers stay in control beyond that. |
Failed Breakout / Correction Case | Price slips back inside the ascending channel, with $0.002255 as the first support, $0.001609 as a deeper level, and $0.001169 only relevant after substantial further deterioration. |
Can the Short Squeeze Turn Into a Sustained Breakout?
The tension here is straightforward even if the outcome is not. A breakout attempt, an overbought daily RSI, a clear short squeeze, and rising open interest are all present at once, and they do not all point the same direction.
The squeeze and the positioning data suggest momentum is real, but overbought readings and elevated leverage also mean the move can unwind quickly if buyers hesitate.
A sustained daily close above the channel would meaningfully strengthen the bullish case. Until that happens, this remains an attempt rather than a result.
What We Are Watching Next
As per the CoinGabbar analyst, a close that holds above the channel, ideally with the RSI cooling from extreme levels, would support the continuation case.
A slip back inside the channel would weaken the breakout attempt and shift attention toward the correction scenario.
The pace of short liquidations is also worth tracking, since a slowdown in forced short covering would remove one of the tailwinds behind the current move.
Disclaimer: This article is for informational purposes only and should not be treated as financial advice. Cryptocurrency markets are highly volatile, and prices can change rapidly based on market conditions. Readers should conduct their own research before making any investment decisions.
Also read:

















