Pump.fun Price Prediction: Can PUMP Extend Its Breakout?


PUMP has done something most altcoins have not managed in months. It broke out, and it did so with real force behind it.
Short sellers have been squeezed, volume has surged and futures traders are piling back in.
But every sharp move raises the same question, and this Pump.fun price prediction looks at whether the rally still has room left or whether it has already run too far too fast.
Why Is PUMP Rising So Fast Today?
PUMP is trading near $0.002801, up 12.54% over the past 24 hours. Market cap sits around $1.1 billion, with an unlocked market cap closer to $2.1 billion once the wider token base is considered.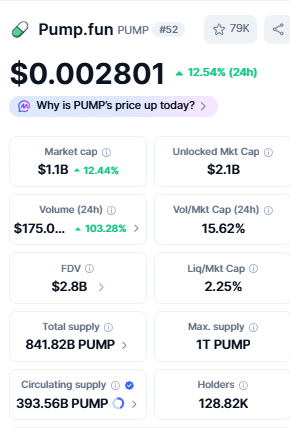
Trading volume has jumped to roughly $175 million, an increase of 103.28% from the prior session, pushing the volume-to-market-cap ratio to 15.62%.
FDV stands near $2.8 billion against a circulating supply of 393.56 billion $PUMP out of a maximum of 1 trillion.
Holders have grown to approximately 128.82K. A near-doubling in volume alongside a double-digit price gain is exactly the kind of combination that gets a coin noticed.
Data source: CoinMarketCap
Did Flipping Hyperliquid in Revenue Spark the Move?
CoinGecko highlighted that PUMP climbed roughly 12.2% after flipping Hyperliquid in 30-day revenue, citing DeFiLlama data in a post shared on X.
This is market commentary rather than an official Pump.fun announcement, but a platform revenue narrative like this tends to pull in fresh trader attention, and that attention shows up quickly in PUMP derivatives data once a rally is already underway.
What Are Futures Traders Doing During the Rally?
Futures activity around $PUMP is broad rather than concentrated on one exchange.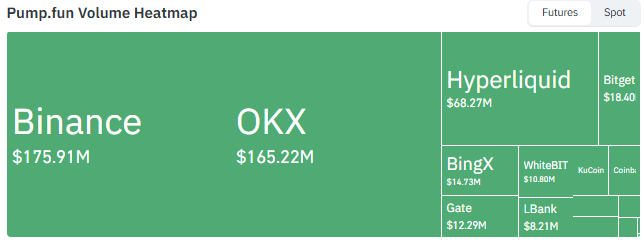
Binance shows roughly $175.91M in futures volume, OKX follows at $165.22M, and Hyperliquid adds $68.27M, with smaller venues contributing the rest. 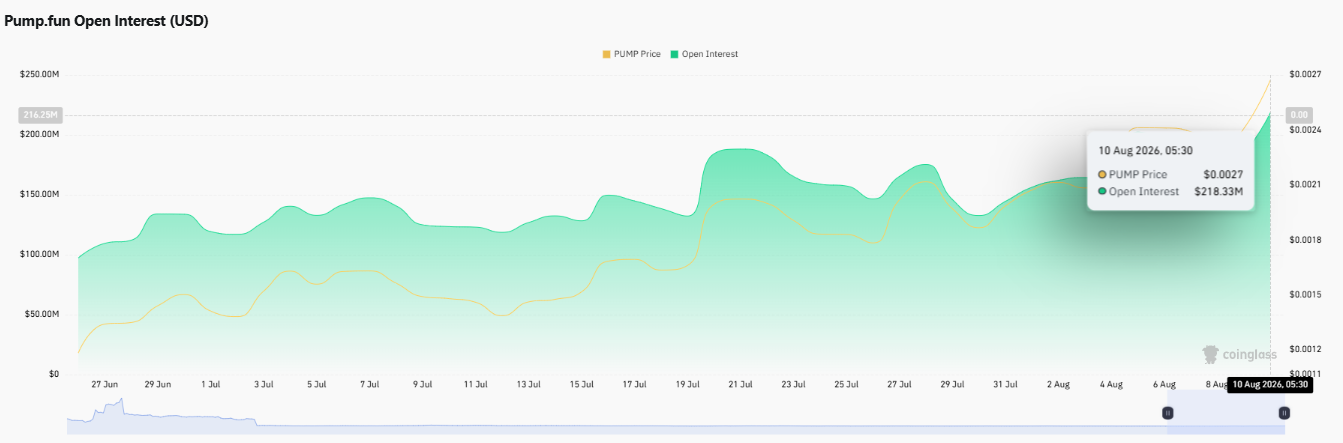
Open interest has climbed to approximately $218.33M, rising alongside the price move, which points to fresh leveraged positioning entering the market rather than just existing traders riding the wave.
More open interest also means more exposure that can unwind quickly if sentiment turns.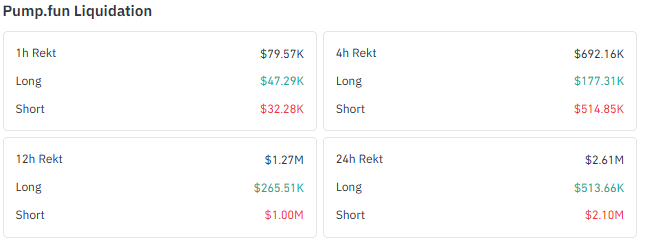
The last 24 hours saw $2.61M in total liquidations, split between $513.66K in long liquidations and $2.10M in short liquidations, roughly four times as much.
That kind of imbalance fits a market where sellers got caught leaning the wrong way as prices pushed higher. Positioning ratios reinforce the same picture.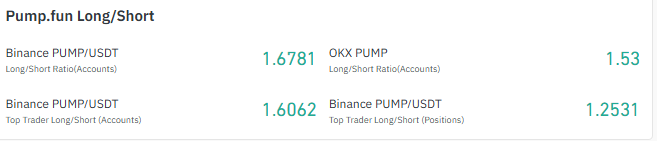
Binance accounts sit at 1.6781 long/short, Binance top-trader accounts at 1.6062, top-trader positions at 1.2531, and OKX accounts at 1.53, all comfortably above 1.
Every ratio in this Pump.fun price forecast leans long, which is unusual compared to the more divided positioning often seen in altcoins.
Heavy, long exposure can fuel further upside if the breakout holds, but it also leaves the market more exposed if the price suddenly turns.
Data source: coinglass
Has PUMP Really Broken Its Ascending Channel?
On the TradingView daily chart, $PUMP has pushed above the upper boundary of its ascending channel, and that move should be treated as constructive while price holds above the structure that produced it.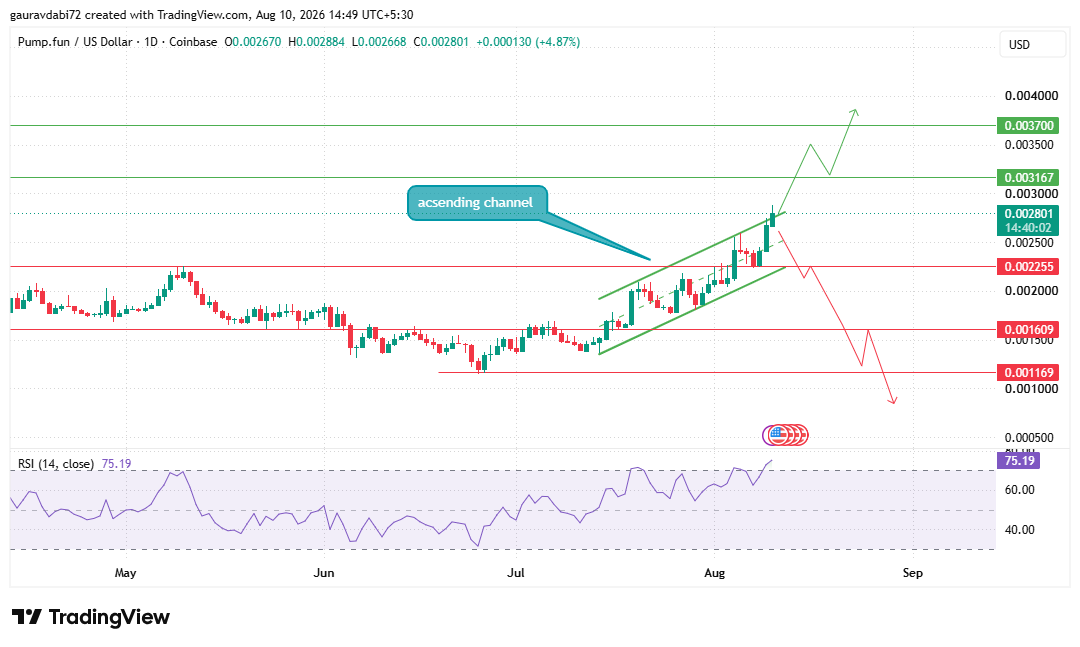
It is a genuine breakout on the data available, not just a wick through resistance. What it still needs is time.
A single push higher does not confirm a new trend on its own, and the more relevant question for this PUMP price prediction is whether buyers can defend the breakout zone on any pullback rather than watch price slip straight back into the old range.
Resistance, Support and an Overbought RSI
Daily RSI has climbed to 75.19, comfortably above the 70 mark that typically signals overbought conditions.
That confirms just how strong the recent push has been, but it is also a warning sign in its own right.
Strong trends can stay overbought for a while, yet the risk of profit-taking or a cooling-off period rises the longer RSI sits at this level.
Price structure still matters more here than the indicator alone.
On the upside, the first resistance to watch sits at $0.003167, with the next major resistance up near $0.003700.
On the downside, $0.002255 is the immediate support that matters most for the current breakout structure.
Losing that level would weaken the bullish setup, and continued selling could expose $0.001609, with $0.001169 marking a deeper support zone further below.
Bull, Neutral, and Bear Scenarios
Bull Case | $PUMP sustains the daily breakout, and buyers keep defending the structure, shifting attention first toward $0.003167 and, on a convincing move through that level, toward $0.003700. |
Neutral Case | $PUMP consolidates or retests the breakout area while RSI cools from overbought levels, without necessarily invalidating the bullish structure as long as $0.002255 continues to hold. |
Bear Case | The breakout fails, and PUMP loses $0.002255 on a sustained basis, exposing $0.001609 first and potentially $0.001169 if selling pressure deepens. |
PUMP Performance Across Timeframes
The short-term chart has cooled slightly, with PUMP down 0.82% over the last 4 hours even as the coin remains up 12.78% on the day. 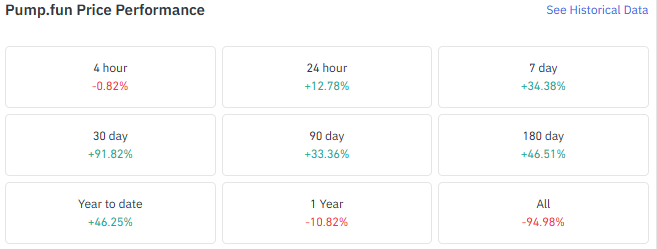
Momentum stretches back further too, with a 34.38% gain over the past 7 days and a 91.82% advance over 30 days, the strongest window in this stretch.
Longer horizons stay positive but less dramatic, up 33.36% over 90 days, 46.51% over 180 days, and 46.25% year to date.
The 1-year figure is still negative at -10.82%, a reminder that this recent surge is a recovery in progress rather than a completed turnaround.
Data source: coinglass
Expert View
As per the Coingabbar analyst, $PUMP's breakout is backed by more than price alone. Volume has expanded sharply, open interest has climbed alongside the move, short positions have been squeezed hard, and positioning across Binance and OKX leans long almost uniformly.
That combination reflects genuine participation rather than a thin, low-conviction spike.
The complication is momentum. RSI at 75.19 shows buyers have already pushed the market into stretched territory, and that raises the odds of consolidation, a retest, or short-term profit-taking before any further sustained move.
Holding above $0.002255 keeps the breakout structure intact. Losing it would shift the conversation quickly toward the lower support zones.
Disclaimer: This article is for informational purposes only and should not be treated as financial or investment advice. Cryptocurrency markets are highly volatile, and prices can move sharply in either direction. Readers should conduct their own research and consult a licensed financial advisor before making any investment decisions. Past performance and technical patterns do not guarantee future results.

















