Siren Price Prediction: Traders Are Suddenly Paying Attention Again


Something shifted for Siren this week, and traders who had written the token off are suddenly checking the chart again. A quiet pattern that had been building for almost two weeks finally broke, and the reaction was not small. Moves like this are exactly why the altcoin market keeps pulling traders back in even during quiet stretches.
Why Everyone Is Suddenly Talking About This Small Cap Again
Siren price prediction talk has picked up fast this week, and it did not come out of nowhere. For nearly two weeks the token had been grinding sideways in a tight, boring range. Boring, until it wasn't.
Basically, price had been coiling inside a rising pattern on the 4-hour chart. Turns out, that kind of quiet setup is exactly what traders watch for. When it finally broke, it broke with force.
We pulled up the chart earlier today, and the first thing that stood out was how fast buyers stepped in once the range gave way. Volume picked up. Momentum followed. And the token that most people had stopped checking was suddenly moving again.
Is this the start of something bigger, or just a short burst before sellers come back? That's the question every trader tracking top memecoins is asking right now.
Key Takeaways
-
Direction: Short-term bias has turned bullish after a range breakout.
-
Reason: Price cleared a multi-day rising pattern with rising volume behind it.
-
Short-term range: Roughly $0.026 to $0.034 over the next few days.
-
Invalidation: A close back below $0.0241 would flip the setup bearish.
What Is The Siren Token, and What Does Its Chart Show
| Field | Detail |
|---|---|
| Coin Name | Siren |
| Ticker Symbol | SIREN |
| Blockchain | BNB Smart Chain (BEP-20) |
| RSI Level | 67.00 (4H) |
| Token Type | Utility / Gaming token |
| Token Category | BSC meme-adjacent gaming token |
| Contract Address | 0x997a58129890bbda032231a52ed1ddc845fc18e1 |
| Market Cap | $25.07M |
| 24H Trading Volume | $27.19M (Futures) |
| 24H Trading Volume Change | +10.04% |
| Circulating Supply | 724.08M SIREN |
| 24H Change | +9.21% |
Source: Data by CoinMarketCap, Data by CoinGlass and Data by DexScreener
Where This Token Came From And Why It Exists
Siren runs on the BNB Smart Chain and positions itself around a gaming and prediction-style ecosystem, with a max supply capped at 1 billion tokens. According to the SIREN token contract, the project currently counts more than 68,000 holders and over 21.6 million transfers since launch.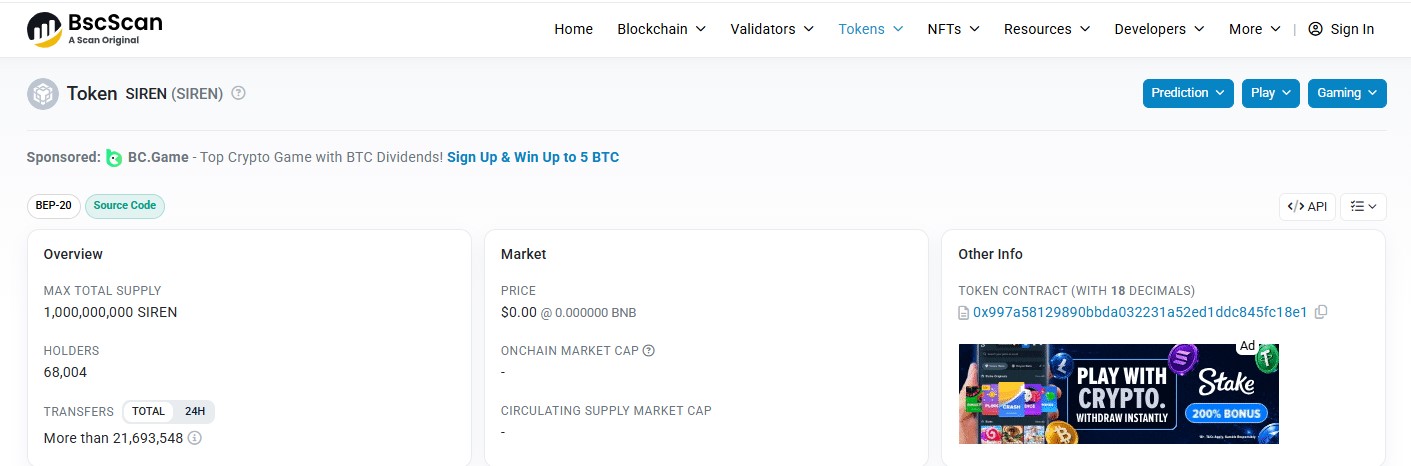
Source: BscScan
How Siren Has Actually Performed Over Recent Weeks
Zooming out on the weekly chart tells a rougher story than the daily bounce suggests. Siren has spent most of this year drifting lower after an earlier run, and this week's move is still small next to that broader slide.
The weekly RSI sits near 44, which is neutral leaning soft, not a full reversal signal yet. Tokens with this kind of chart history usually show up sooner or later in broader crypto price prediction roundups once momentum returns.
Source: TradingView (Weekly)
Why This Small Cap Token Still Has Traders Watching
Siren is not just riding hype. The project holds active liquidity on PancakeSwap and maintains listings across several mid-tier crypto exchanges, including KuCoin, MEXC, Gate, and Indodax, which keeps the token reasonably accessible.
But real usage matters more than listings alone, and that is where the token still has work to do. Growing daily traders and consistent volume, rather than one loud green candle, will decide if this rally has legs.
Source: BscScan, DexScreener
How Much Money Got Liquidated As Siren Moved
As per CoinGlass, the last 24 hours saw $73.11K in total Siren liquidations, and the split tells the real story. Long positions accounted for $69.26K of that figure against just $3.85K in shorts, meaning plenty of leveraged longs got flushed out even as spot price climbed.
Source: Liquidation data by CoinGlass
What The Fundamentals Say Beyond The Chart
Fundamentally, Siren's supply picture is worth sitting with. According to BscScan holder data, the top wallet alone controls close to 39% of supply through an exchange router, and a further 27.6% sits in a burn address. Whale wallets overall make up just 0.46% of holders yet control 95.93% of total supply.
That kind of concentration means price can move fast in either direction on relatively thin volume, which is also why projects running fresh crypto airdrops often see similar early volatility.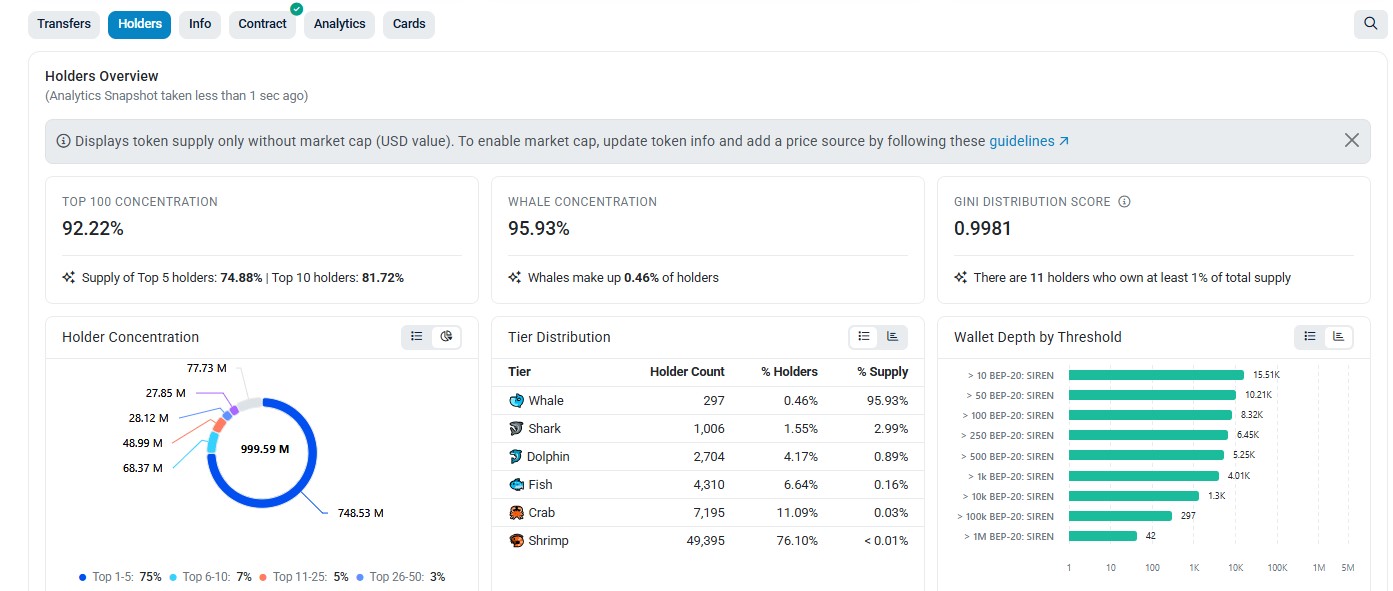
Sources: BscScan, Holder Analytics
Technical Chart Analysis: Siren Rallies 9% As Chart Pattern Finally Breaks
Price didn't wait for permission. The move higher on the 4-hour chart followed a clean break above a multi-day ascending triangle pattern, and it happened with real volume behind it, not a thin wick.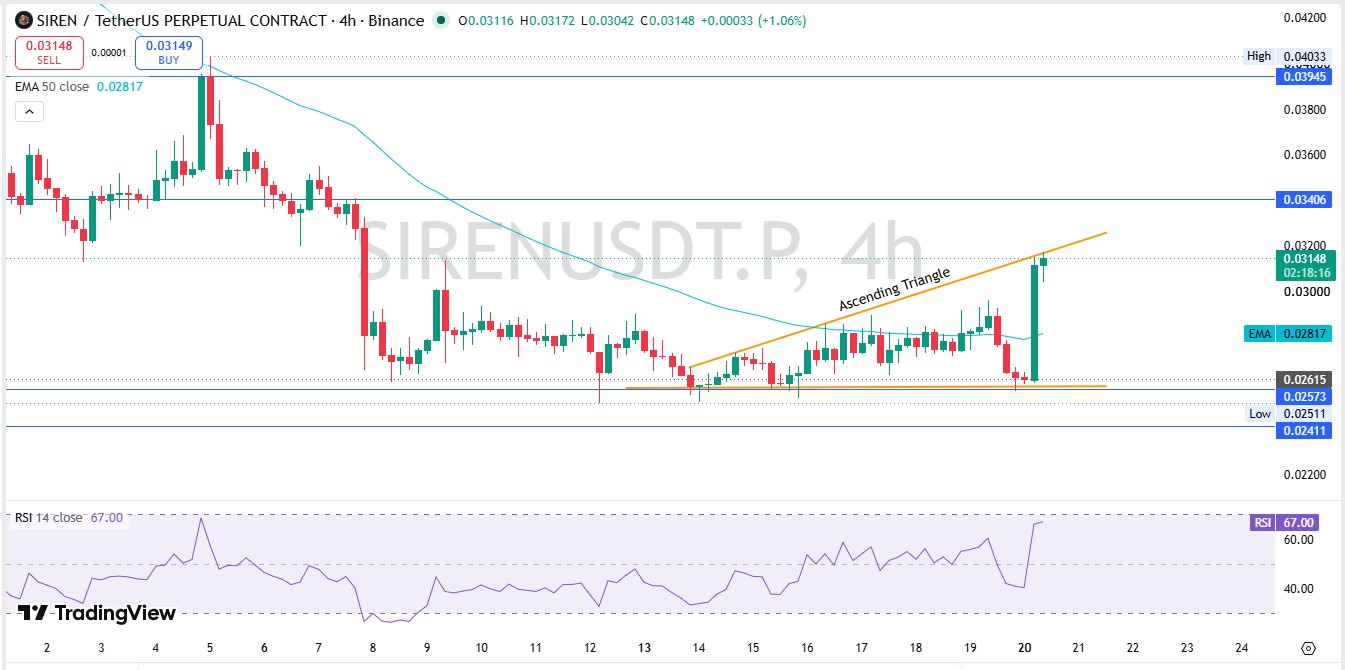
Source: Charts by TradingView
Price is trading above its 50 EMA at $0.02817, which, as per TradingView charts, keeps the short-term trend structure tilted bullish. RSI at 67 shows strong momentum without yet flashing overbought extremes.
Immediate resistance sits at $0.03406, and a close above that on rising volume opens the door toward $0.03945.
Support has shifted up to $0.02615, with the broader invalidation zone at $0.02411. Losing that level would undo the entire bullish case built over the past two weeks. Watch volume on any retest of $0.034: that is what confirms continuation.
Where Is Siren Trading Volume Actually Coming From
According to CoinGlass, Binance dominates Siren futures activity with $16.58M in 24-hour volume, followed by BingX at $2.60M and Bybit at $2.28M. Spot volume remains far thinner by comparison, a gap worth watching alongside broader blockchain crypto news this week.
Source: Volume heatmap by CoinGlass
How Siren Stacks Up Against Other Small Cap BSC Tokens
Compared to other low-cap BNB Chain tokens, Siren's holder base of 68,000-plus is relatively large, but its concentration risk is higher than many peers with similar market caps. Liquidity on DEX pools remains thin near $16K, which, as per the SIREN DEX data, means larger trades can move price sharply in either direction.
Siren Short-Term Price Prediction: What The Next Few Days Could Bring
In the short term, the setup favors continuation as long as the price holds above the base support zone carved out this week, a pattern also common among newer crypto presale listings finding their first real support.
| Timeframe | Bearish Level | Bearish Target | Pivot / Base Level | Base Target | Bullish Level | Bullish Target | Invalidation |
|---|---|---|---|---|---|---|---|
| 24 Hours | Key Support | $0.02615 | Base Support | $0.02817 | Triangle Resistance | $0.03406 | Break below Base Support |
| 3-7 Days | Lower Support | $0.02573 | Key Zone | $0.03000 | Key Resistance | $0.03945 | Lose Key Support |
| 2-4 Weeks | Major Support | $0.02411 | Key Resistance | $0.03406 | Major Resistance | $0.04500 | Weekly close below Lower Support |
Source: TradingView (4H). Watch the $0.034 retest closely; that's the level that decides the next leg.
Siren Long-Term Price Prediction: The Bigger Picture Into 2027
Longer term, the case for Siren depends far more on adoption and sustained volume than on any single chart pattern, and it is worth checking the coin events calendar for anything that could shift that demand.
| Timeframe | Bearish Level | Bearish Target | Base Level | Base Target | Bullish Level | Bullish Target | Catalyst Needed |
|---|---|---|---|---|---|---|---|
| 3 Months | Weekly Support | $0.020 | Weekly EMA Zone | $0.035 | Weekly Resistance | $0.055 | Hold weekly support and rising volume |
| 6 Months | Range Low | $0.015 | Key Resistance Zone | $0.050 | Major Resistance | $0.085 | Ecosystem growth and sustained demand |
| End of Year | Macro Support | $0.010 | Major Resistance | $0.100 | Major Breakout Zone | $0.150 | Break above major weekly resistance |
| 2027 Outlook | Macro Support | $0.007 | Major Resistance | $0.200 | New ATH Extension | $0.330 | New ATH, adoption and crypto bull market |
Source: TradingView (Weekly).
The honest take: the long-term case is far from proven, and it leans heavily on this token holding onto its exchange listings and growing real trading activity, not just chart geometry.
Three Price Scenarios: How Siren Could Actually Play Out
Worst Case: Price loses the $0.0241 invalidation zone. Heavy long liquidations and thin liquidity accelerate the drop toward $0.015.
Base Case: Price consolidates between $0.026 and $0.034 for a few weeks. Traders wait for a decisive close above resistance before committing further.
Best Case: Volume sustains above the breakout level. Price clears $0.03945 and pushes toward $0.045, dragging fresh buyers back in.
| Scenario | Price Range | What Triggers It |
|---|---|---|
| Worst Case | $0.010 - $0.015 | Close below $0.0241, heavy long liquidations |
| Base Case | $0.026 - $0.034 | Sideways consolidation, low conviction either side |
| Best Case | $0.039 - $0.045 | Volume-backed breakout above key resistance |
Key Siren Price Levels Every Trader Should Be Watching
Resistance zone: $0.03406 first, then $0.03945. A volume backed closely either opens room for continuation.
Support zone: $0.02615, backed by $0.02573. Holding here keeps the bullish structure intact.
Invalidation zone: $0.02411. A weekly close below this level would undo the current bullish read entirely.
Siren Analyst View And Final Thoughts On The Current Setup
The chart right now tells a fairly clean story. Price broke a rising pattern, RSI confirmed the move at 67, and volume backed the breakout rather than faking it.
But the fundamentals underneath are messier. Nearly 96% of supply sits with whale wallets, and that changes how much weight to put on any single candle.
A weekly close above $0.03406 would be the strongest signal buyers actually mean business here. Until that happens, this remains a short-term bounce inside a longer downtrend, not a confirmed reversal.
One thing worth tracking beyond the chart: exchange listing stability, along with anything breaking in the latest crypto news that could shift sentiment fast. Losing a major listing would hit liquidity hard given how thin the DEX pool already is.
The most important level right now is $0.0241. Everything bullish falls apart below it.
That's the whole setup in one line: watch the level, not the noise.
Siren Risk Factors Traders Should Not Ignore
-
Liquidity risk: DEX liquidity sits near just $16K, making large trades capable of swinging price sharply.
-
Concentration risk: A single wallet controls close to 39% of circulating supply, and whales overall hold over 95%.
-
Volatility risk: 24H liquidations already hit $73K, showing how quickly leveraged positions get wiped in both directions.
Disclaimer
This article is for educational purposes only and does not constitute financial advice. Crypto markets are volatile. Consult your investment advisor before making any investment decision.
Also read:
















