Solana Price Prediction: A Chart Pattern Bears Don't Want You to Miss


Solana (SOL) is trading near $72.97, down 1.78% over the past day. The token has now posted ten straight red monthly candles, a losing streak that has traders on edge.
This Solana price prediction looks at fresh chart data, derivatives numbers, and liquidation stats to see where SOL might head next.
Why did Solana lose its rising channel?
As per Ali, SOL recently broke below a rising price channel it had held for weeks. This kind of move often signals that buyers are losing grip.
Once a rising channel breaks, the next stop is usually a test of lower support zones. For SOL, that path could lead toward $60 if selling keeps up.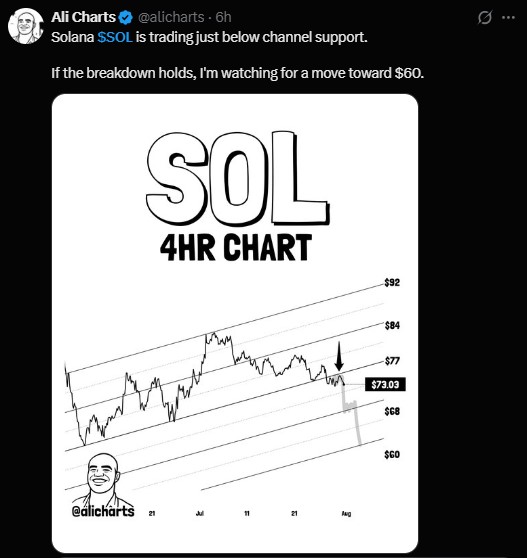
What does the 4-hour chart show for SOL?
On the 4-hour timeframe, Solana is stuck inside a descending channel. Price is hovering around $73.34 as of writing.
SOL has tried more than once to push above the channel's upper line near $76.00. Each attempt has failed so far.
A clean close above $76.00 would weaken the bearish setup. That could open a path toward $84.00 next.
But if $72 support gives way, sellers may push altcoin toward $69.50. A deeper slide could test $64.00.
Where is Solana's key support and resistance right now?
Level Type | Price | Notes |
Resistance 2 | $84.00 | Next target above channel breakout |
Resistance 1 | $76.00 | Upper channel boundary |
Current Price | $72.97 | As of writing |
Support 1 | $72.00 | Immediate support |
Support 2 | $69.50 | Next level if $72 breaks |
Support 3 | $60.00–$64.00 | Downside target on heavy selling |
What does the RSI say about Solana momentum?
The Relative Strength Index (RSI) sits below the neutral 50 mark. This tells traders that bearish momentum still has the upper hand.
Even with some bounce attempts lately, RSI has not managed to flip back above that midline. Until it does, the short-term trend leans down.
What do Solana derivatives and liquidation data show?
Futures volume over 24 hours sits at $4.34 billion, down 16.71%. Open interest is $4.60 billion, down 1.10% on the day.
Options volume jumped 59.36% to $12.17 million, even as options open interest dropped 37.28% to $67.55 million. That mix suggests traders are actively repositioning rather than sitting still.
The long/short ratio over 24 hours reads 0.9486, close to balanced but tilted slightly toward shorts.
On Binance, the SOL/USDT account long/short ratio stands at 2.8183, and OKX shows a similar 2.9 ratio among accounts. Top traders on Binance show a 3.095 account ratio but a lower 1.6611 position ratio, hinting that big players are more cautious with their actual position sizing than smaller accounts.
Liquidation data adds more color. Over the past 24 hours, $6.13 million in SOL positions got wiped out, with longs taking the brunt at $5.90 million versus just $234.43K in shorts.
The 12-hour window tells a similar story: $637.20K liquidated, mostly longs at $623.41K. This pattern shows traders betting on a bounce have repeatedly gotten squeezed out.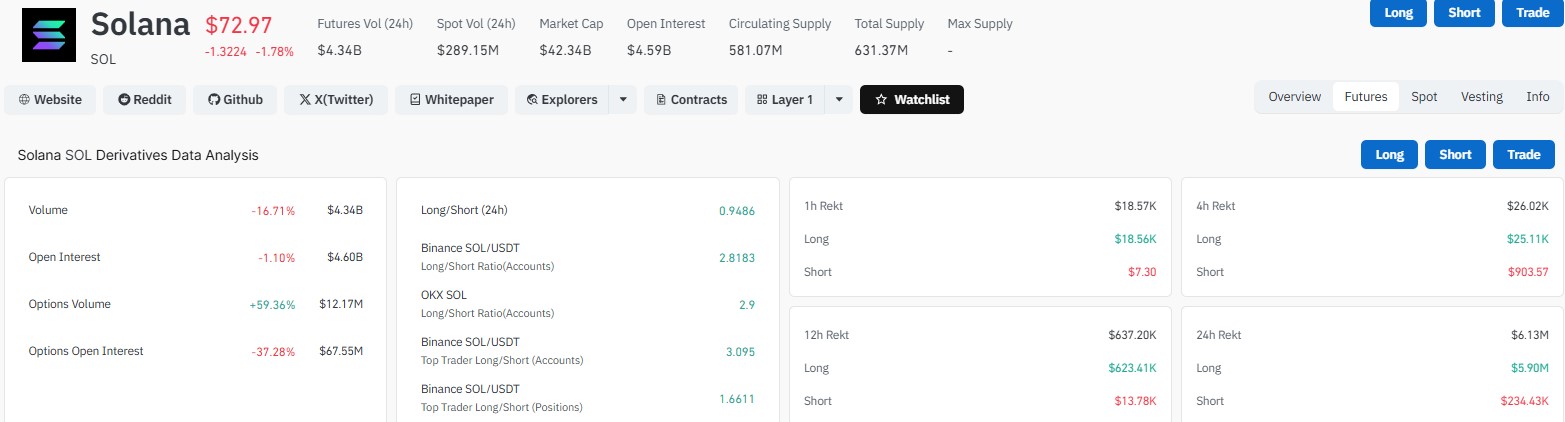
Is Solana's losing streak close to ending?
Ten red monthly candles in a row is rare for any major token. Some traders see this as a sign of exhaustion, where sellers may soon run out of steam.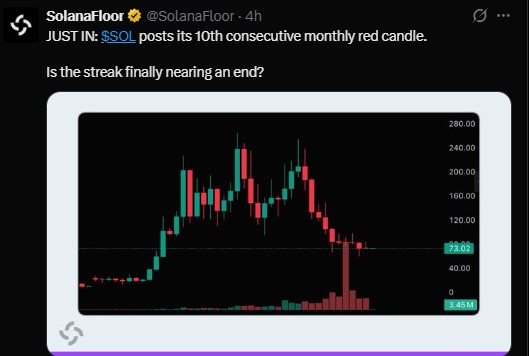
Others point out that momentum indicators and channel breaks still favor the downside for now. A firm reclaim of $76, backed by stronger volume, would be the first real clue that the streak is cracking.
Until then, Solana price action remains a wait-and-watch setup, with $72 as the line in the sand.
Disclaimer
This article is for informational purposes only and does not constitute financial, investment, or trading advice. Always do your own research (DYOR) and consult a licensed financial advisor before making any investment decisions. Past performance is not indicative of future results.















.jpg)




