Solana price prediction: Why analysts remain bullish on SOL price


Solana is trading near $79 today, up slightly on the day. The token has spent the last few weeks stuck under a tough resistance band. Traders are watching closely to see if SOL can finally break through.
This Solana price prediction looks at the daily chart, on-chain supply data, futures positioning, and fund flows. All of it points to one thing. The altcoinis sitting at a make-or-break zone.
Where is Solana's price right now?
The altcoin is changing hands around $79, according to data from CoinStats. The coin is up more than 1% over the past day. It remains well below its highs from earlier this year.
Zooming out, the altcoin is down sharply from levels above $130 seen in December. The daily chart shows a long slide that only recently started to slow down.
Why is the $79 to $85 zone so important for SOL?
Analyst Ali Charts, in a widely shared post, pointed to a dense supply cluster between $79 and $85. On-chain data known as URPD shows roughly 105 million SOL changed hands in this exact price band.
That means a lot of holders bought or sold their SOL somewhere in this range. Many of them are sitting near breakeven right now. That creates a wall of potential sellers.
If Solana can climb above $85 and hold there, this old resistance could flip into support. That would clear the way for a move toward $100, and possibly $127 after that.
If SOL fails here again, the picture gets darker. A clean rejection from this zone could send sellers rushing for the exits. The next support sits near $53.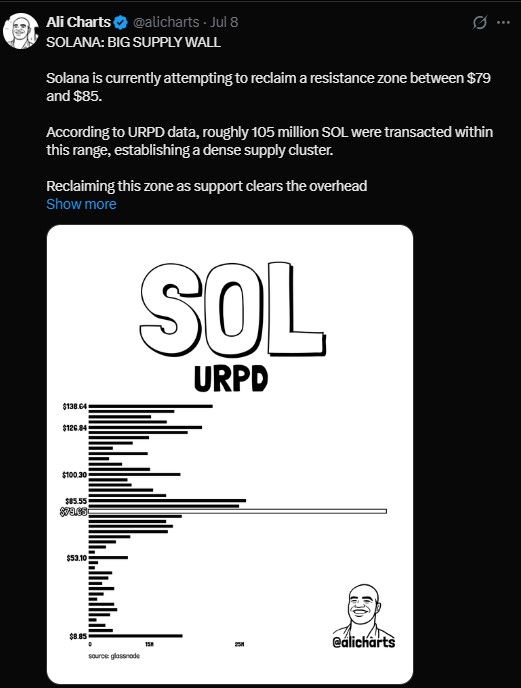
What do the charts say about Solana right now?
The daily SOL/USDT chart shows price grinding higher inside a rising wedge pattern since early June. Price bounced from a low near $60 and has been making higher lows since.
The 20-day and 50-day moving averages are curling upward, a small but early sign of momentum shifting. The RSI sits near 57, which is neutral. It is not overbought and not oversold.
On the weekly chart, a longer-term picture shows SOL bouncing off a support zone that has held since late 2022. A steep downward trendline from the 2025 high still caps price action above.
What does the futures and options market show?
Futures open interest on SOL sits around $5.25 billion, data shows. That figure barely moved over the past day, suggesting traders are not rushing to add new bets in either direction.
Long and short positioning is tilted toward longs on major exchanges. The Binance top trader long-short ratio sits above 2, meaning more large accounts are betting on a bounce than a drop.
Liquidation data tells a mixed story. Over the past 24 hours, short sellers lost more money to liquidations than long traders. That suggests short-term price action has favored buyers.
Are institutions still buying Solana?
Fund flow data shows a choppy picture over the past week and a half. Solana-linked investment products saw a net outflow of about $605,000 on July 9. That followed an outflow of $8.65 million the day before.
Earlier in the week told a different story. Inflows of $1.67 million and $8.36 million came in on July 7 and July 6. Total net assets in these products still sit above $900 million.
Date | Daily Net Flow | Total Net Assets |
Jul 9, 2026 | -$605.11K | $904.67M |
Jul 8, 2026 | -$8.65M | $894.05M |
Jul 7, 2026 | +$1.67M | $949.75M |
Jul 6, 2026 | +$8.36M | $957.14M |
Jul 2, 2026 | +$2.20M | $936.01M |
Jul 1, 2026 | +$521.07K | $891.24M |
The swings suggest institutional demand has not fully committed either way. Money is moving in and out fast as investors wait for a clearer signal.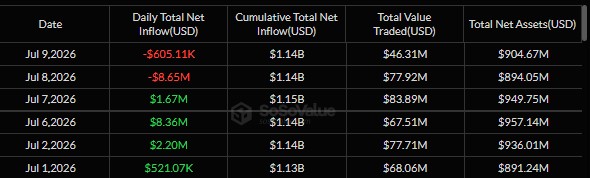
What is happening on the Solana network itself?
Away from price charts, Solana's use case as a home for tokenized stocks keeps growing. Recent data shared by the Solana team claims that nearly 95% of all onchain tokenized-equity trading now happens on the network.
Cumulative tokenized-stock volume has reportedly hit $10 billion, up roughly 180% in a single month. Trading platform Backpack reportedly saw $108 million in volume for a tokenized SpaceX stock product on the day of its IPO.
This kind of real-world asset activity is one reason some analysts remain long-term bullish on SOL, even with short-term price action stuck in a range.
What are analysts saying about Solana's outlook?
Some traders following SOL closely say the coin has shown one of the strongest defenses of support in this market cycle. They see a real chance for a new all-time high by the end of the year, with a six to nine-month target near $400.
Other voices are more cautious, noting that Bitcoin and Ethereum could still outperform Solana on a percentage basis even if SOL grinds higher.
This split in views is common right now. The charts show a coin at a real decision point, not a coin with a guaranteed direction.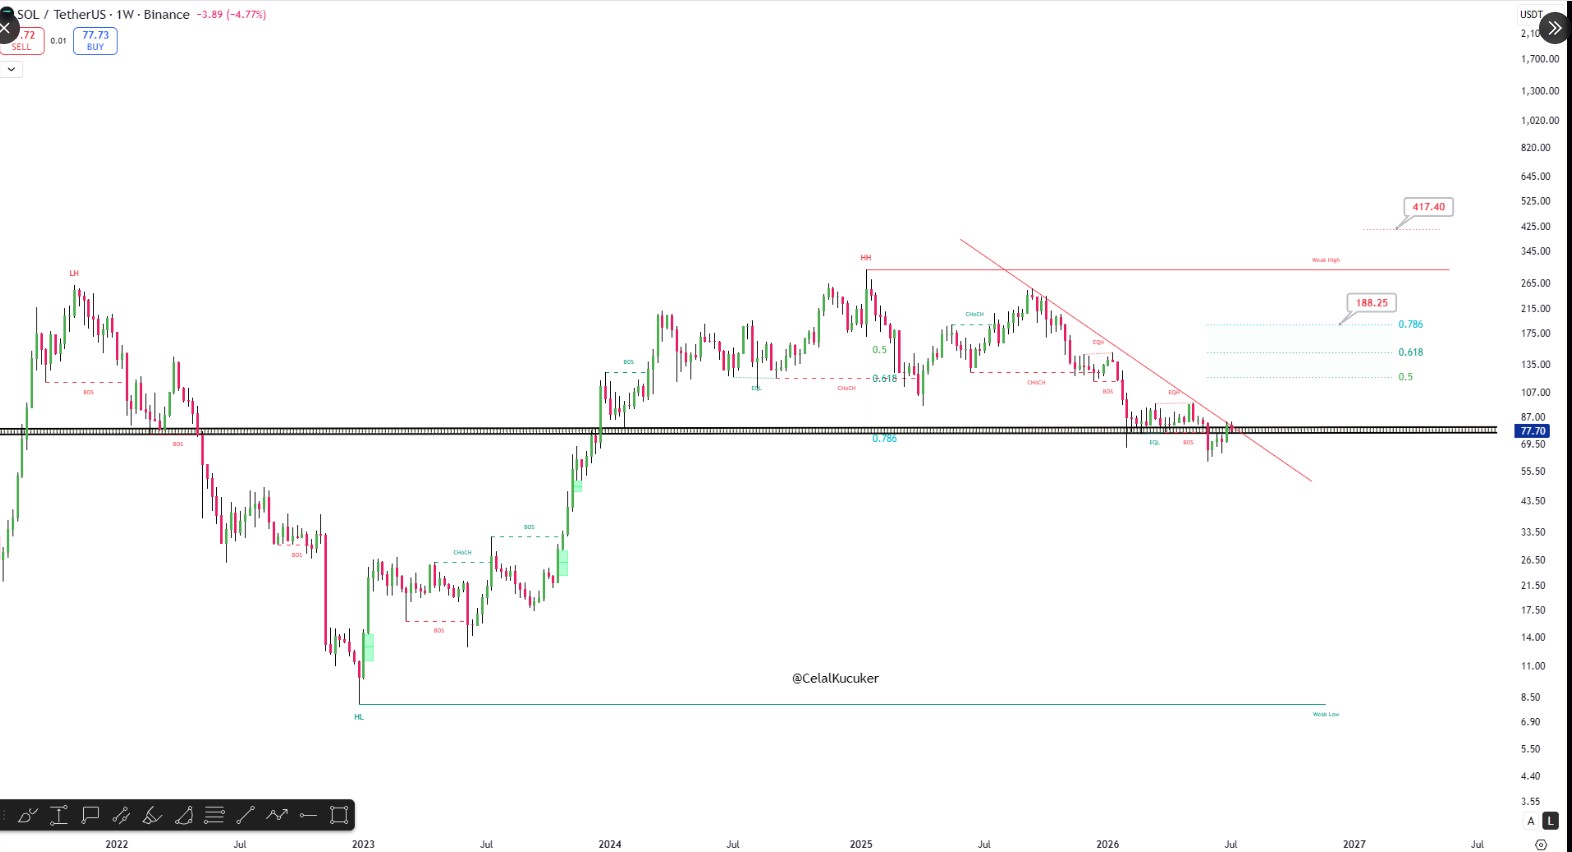
Solana price prediction: what to watch next
The next few weeks look important for SOL. A close above $85 on strong volume would be the clearest bullish sign. That would open the door toward $100 and then $127.
A failure to hold above $70 to $76 support, on the other hand, would be a warning sign. That could send SOL back toward the $53 zone seen earlier this year.
For now, Solana sits in a wait-and-see zone. Fund flows are choppy. Futures traders lean slightly bullish. The chart shows a coiled setup that could break in either direction.
Disclaimer
This article is for informational purposes only and should not be considered financial or investment advice. Cryptocurrency markets are highly volatile and carry significant risk. Prices mentioned may have changed by the time you read this. Always do your own research and consult a licensed financial advisor before making investment decisions.

















