Official Trump Price Prediction 2026-2050: Can Trump Go to 100x?


Official Trump (TRUMP) is trading near $1.61 on July 10, 2026.
This official Trump price prediction 2026-2050 report looks at where the token stands right now on the monthly chart, why it has fallen so hard from its launch-day highs, and what near-term and long-range price targets look like heading into 2030, 2040, and 2050.
Where is the official Trump price right now?
TRUMP/USDT sits at $1.611 on the 1-month chart, down 2.83% on the daily candle. The current month opened at $1.659, tapped a high of $1.878, and printed a low of $1.568 before sellers pinned the price near the bottom of that range.
That single candle tells most of the story. Buyers tried to push the token back toward $1.90 earlier in the period.
But the attempt failed, and the price rolled straight back down toward multi-month lows, which is exactly the kind of rejection that keeps a downtrend intact.
Why Has TRUMP Fallen So Far From Its Highs?
$TRUMP launched on Solana on January 17, 2025, days before $Trump's second inauguration, and exploded almost immediately, briefly touching a $27 billion market cap within its first day.
The all-time high, around $73–74, printed two days later on January 19, 2025.
Since then, the monthly chart has ground lower in a steady descent that has wiped out roughly 98% of the token's value, leaving the price barely above its all-time low of $1.50.
Two factors explain most of it: only 200 million of the 1 billion total tokens were released at launch.
The remaining 800 million are unlocking gradually over three years and adding steady supply pressure, and liquidity is thin relative to the token's size, so even moderate selling moves price sharply.
How Many Holders Are Sitting at a Loss?
This is the number getting the most attention right now. On-chain analytics firm Nansen found that of roughly 1.48 million wallets that bought $TRUMP, about 989,000 of them are currently underwater, with combined losses of $3.81 billion through the end of June 2026.
More than twice as many addresses have been selling as buying over the past 24 hours, a roughly 2.32-to-1 ratio.
That kind of lopsided, loss-heavy holder base is unusual even by memecoin standards, and it reflects how much of the token's supply was bought well above today's price during the January 2025 mania.
What Do the Technicals Show?
Layering the chart's own levels onto current price gives a clean read on the setup: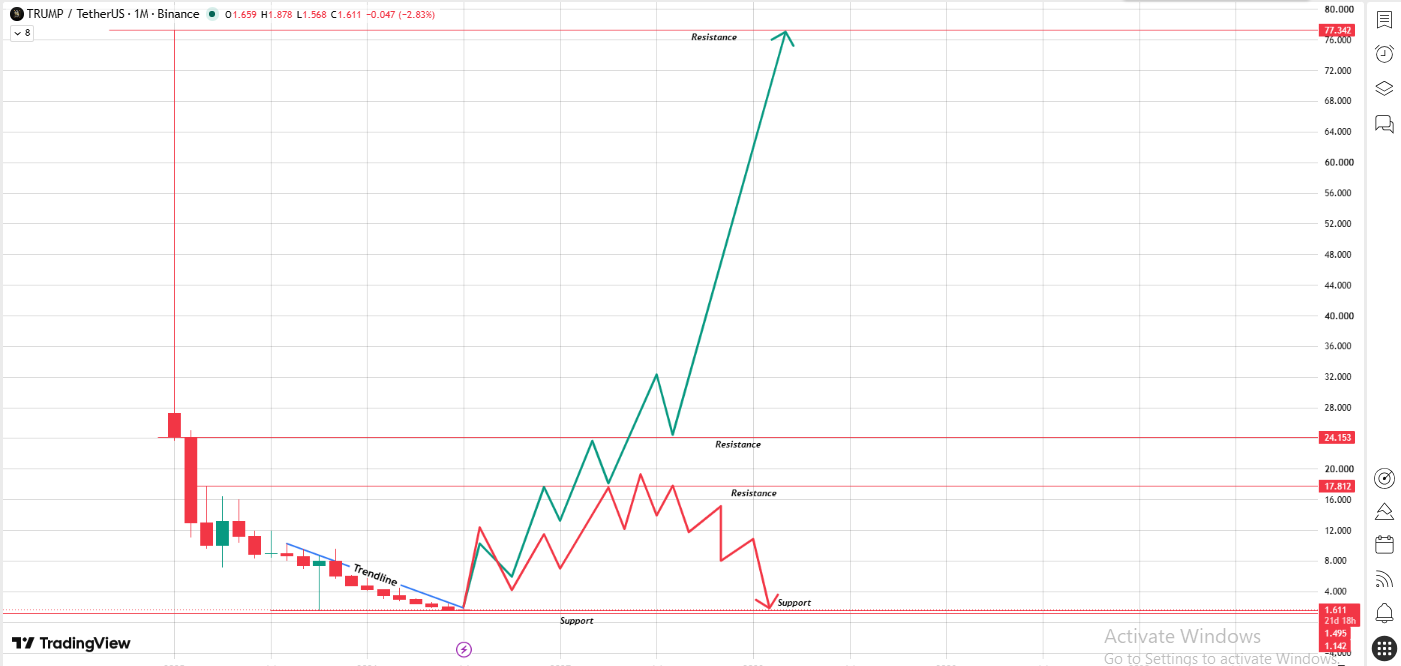
Source: Chart Taken From TradingView
Immediate support sits in the $1.50–$1.14 zone, matching the token's all-time low. A monthly close below this band would open a new leg lower with little historical price memory beneath it.
First resistance is the trendline; if it breaks the upper level, it will come at the $4–$8 shelf, followed by a firmer ceiling at $17.81.
Major resistance sits at $24.15, a level where price stalled twice during the 2025 rally before the final blow-off move.
The ultimate ceiling remains the $77.34 region, the current price marking the all-time high spike, a level that is a long way from the current price and would require a multiple of today's value just to retest.
Does TRUMP Have Any Utility Beyond Speculation?
Beyond pure price speculation, the project has leaned into membership-style perks through the $TRUMP Coin Club.
Which links holdings to access-based experiences, leaderboard competitions, and invitation-only events, including a 2026 leaderboard tied to the FIFA World Cup Final.
Whether these utility features are enough to offset ongoing sell pressure and supply unlocks is one of the bigger open questions for anyone modeling TRUMP's price beyond the next few months.
Official Trump Price Prediction 2026: Where Does TRUMP Go From Here?
For the rest of 2026, forecasts vary sharply depending on whether the current downtrend simply stabilizes or whether a fresh political or crypto-market catalyst reignites demand.
More conservative scenarios have TRUMP consolidating in the $1.20 to $4 range for the remainder of the year, essentially basing out above its all-time low while supply unlocks continue to cap rallies.
More optimistic scenarios, which assume a broader crypto market recovery plus renewed retail interest tied to political or crypto-policy headlines, point toward the $14 to $42 zone by year-end, with the trendline resistance and the $17.81 level acting as the first real tests of that thesis.
Reclaiming the broken monthly trendline and holding above $8 would be the first technical signal that the worst of the down move's price is over.
Until that happens, the path of least resistance stays lower.
Official Trump Price Prediction 2027 to 2030
Looking out toward 2027, forecasts cluster into two broad camps.
The bearish case has $TRUMP continuing to bleed supply pressure and holder fatigue, keeping the price under $10 for most of the year.
The bullish case ties a recovery to $Trump-brand and crypto-policy tailwinds, with targets stretching toward $30–$50 if the token can reclaim and hold the $24 resistance shelf.
By 2028 and into 2029, the 800-million-token unlock schedule becomes the dominant variable.
If a meaningful share of those tokens is sold into the market as they unlock, that supply overhang could keep a lid on price even during broader crypto bull phases.
If instead a large portion is held long-term or locked into Coin Club-style programs, scarcity could support a stronger recovery.
For 2030, target ranges published by other analysts span widely from roughly $2 on very conservative, low-growth models up to the $200+ area on scenarios that assume $TRUMP fully retraces its 2025 highs and pushes into new territory.
Given the token's political nature and its dependence on continued brand relevance, this is one of the widest uncertainty bands of any actively traded token in the current market.
Official Trump Price Prediction 2040
By 2040, any TRUMP forecast is scenario-based, not chart-based; the real question is whether the token and political memecoins as a category are still culturally and financially relevant 14 years out.
Bullish models, assuming durable Coin Club-style utility, put figures in the double-digit to low-hundreds range.
Bearish models, assuming the category fades once the political moment passes, put it near a fraction of a dollar. Neither carries much confidence at this distance.
Official Trump Price Prediction 2050
A 2050 figure for TRUMP is closer to a thought experiment than a forecast.
Political memecoins have no multi-decade track record to model from.
Optimistic scenarios assume $TRUMP becomes lasting crypto infrastructure and sits well above today's price; conservative scenarios assume it fades with the political moment and settles at a small fraction of a dollar.
Any specific "2050" number should be read as a guess, not an estimate.
Official Trump (TRUMP) Price Prediction Target Table
Note: Table figures are illustrative scenario ranges based on chart technicals and publicly available analyst commentary, not guaranteed outcomes.
What's Next in the Near Term?
The monthly chart is unambiguous about where the battle lines sit today.
$TRUMP is trading just above its $1.50–$1.14 support shelf, with layered resistance stacked at $17.81 and $24.15 above that, and the $77.34 all-time high zone sitting far overhead as the ultimate long-term target bulls would need to reclaim.
Until the price closes back above the broken trendline and starts stacking higher lows on the monthly chart, the setup favors continued consolidation near the lows rather than a fast recovery.
A confirmed loss of the $1.50 support would open the door to fresh lows with very little chart history to slow the decline.
A reclaim of $8 to $17.81, on the other hand, would be the first real sign that a longer-term bottoming process is underway.
Disclaimer: This article is for informational purposes only, not financial advice. TRUMP and other memecoins are highly volatile and speculative, and all long-range targets here are illustrative, not guarantees. Do your own research and consult a licensed financial advisor before investing.

















