Solana Price Prediction: Will SOL Price Hit $90 Level This Week?


What Is the Solana Price Today?
Solana price is changing hands around $75.92, down 1.84% on the day. The Solana price has spent weeks stuck in a tight range between $73 and $80.
Traders are now watching one thing closely. Will Solana price finally break above resistance, or slide back toward recent lows?
This report breaks down the charts, the ETF flows, and the macro backdrop shaping where SOL might head next.
What Is Solana's Market Cap and Trading Volume Right Now?
Solana's market cap sits at $44.18 billion, with a circulating supply of 582.86 million $SOL. Daily futures volume reached $5.97 billion, while spot volume came in at $317.58 million.
Open interest climbed slightly to $4.93 billion, up 0.69% on the day. That shows traders are still active even as price chops sideways.
| Metric | Value |
| Price | $75.92 |
| 24h Change | -1.84% |
| Market Cap | $44.18B |
| Futures Volume (24h) | $5.97B |
| Open Interest | $4.93B |
| Circulating Supply | 582.86M SOL |
| Options Open Interest | $102.87M |
Are Traders Going Long or Short on Solana?
Derivatives data shows a mixed picture. The Binance SOL/USDT account long/short ratio sits at 2.52, meaning more accounts are positioned long.
But the top trader position ratio on Binance is lower, at 1.60. That gap suggests smaller retail accounts are more bullish than large traders right now.
Liquidations tell a similar story. Over the past 24 hours, $7.21 million in long positions were wiped out compared to $421,000 in shorts. Longs have been paying the price for recent dips.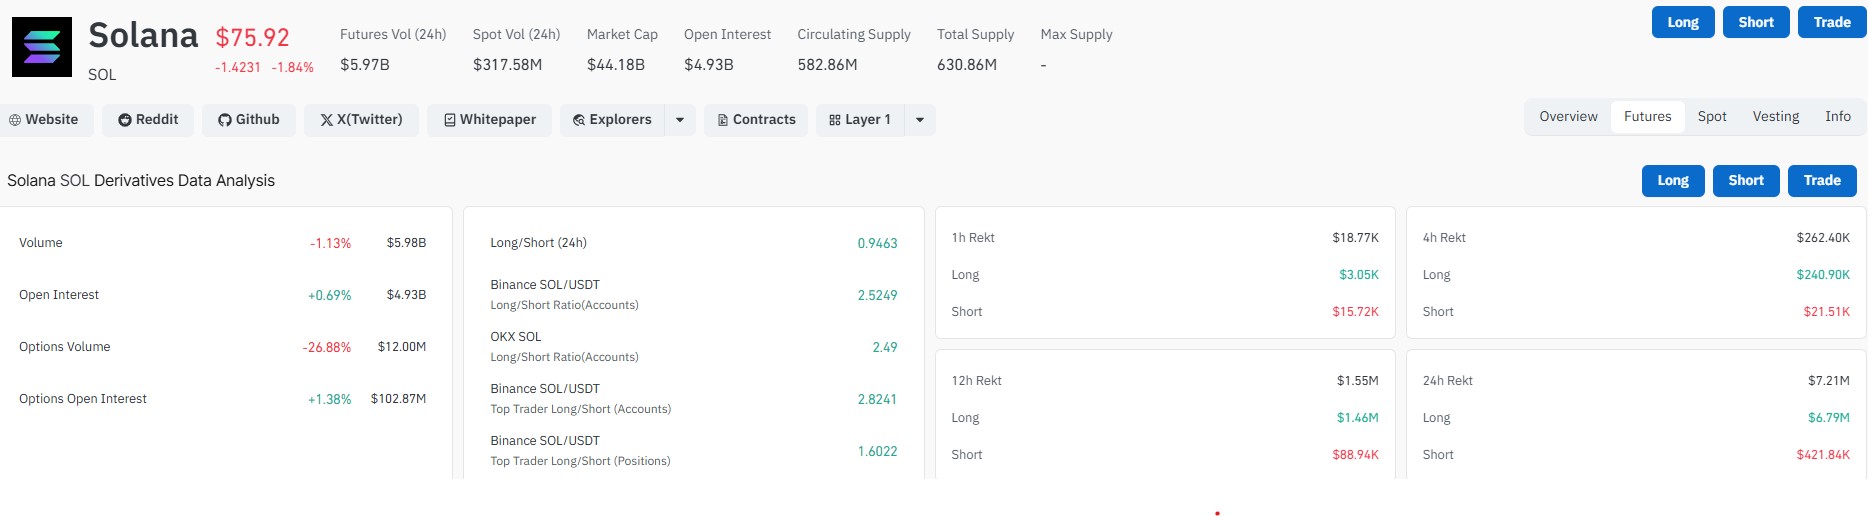
How Much Money Is Flowing Into Solana ETFs?
Spot SOL ETFs pulled in $11.80 million this month, according to SoSoValue data. Total net assets across these funds stand at $885.84 million.
That is an improvement from June, when the funds saw a $786,000 outflow. Still, July's pace is far below May, when investors added $115 million in a single month while SOL traded near $80.
At the current run rate, July inflows could land near $16 million. That would mark a slow recovery, not a flood of new money.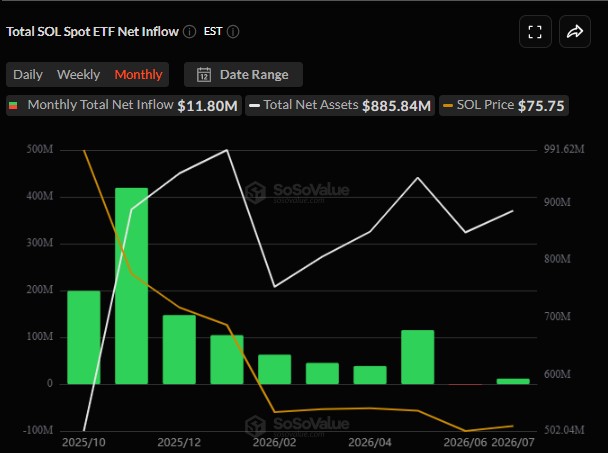
How Will the Fed Rate Decision Affect Solana Price?
The macro backdrop is not helping altcoins. CME FedWatch data shows a 66.3% probability of no change at the July 29 Fed meeting, with 33.7% odds pointing toward a rate hike.
Rising oil prices tied to ongoing tension involving Iran have pushed some analysts to reconsider their rate outlook. A hawkish tilt from the Fed tends to weigh on risk assets like SOL.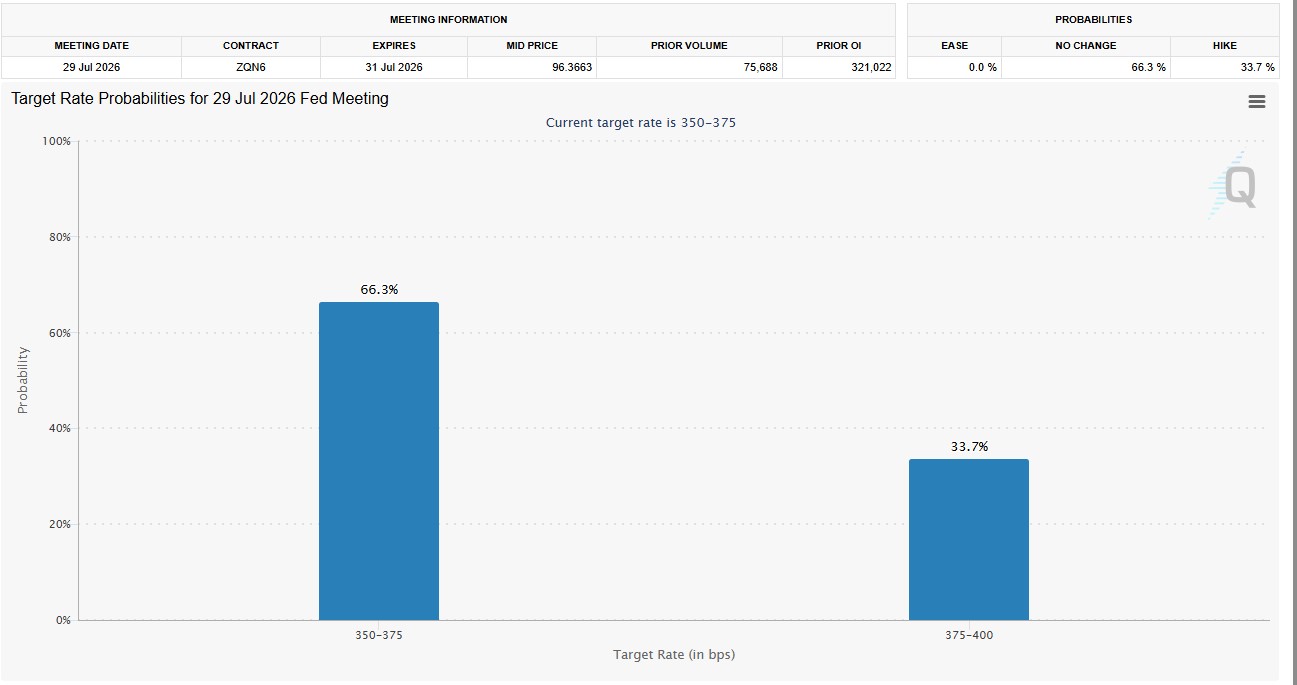
What Are Solana's Key Support and Resistance Levels?
The daily chart shows SOL consolidating inside a rising wedge after bouncing off a low near $60 in early June. Price is holding above its ascending trendline and near the 20-day and 50-day EMAs.
However, $SOL remains below the 100-day and 200-day EMAs, which sit near $80 and $93. That keeps the longer-term trend cautious.
| Scenario | Level | Target |
| Bullish breakout | Above $80-$82 | $88-$90, then $95-$100 |
| Bearish breakdown | Below $73-$74 | $68, then $60 |
A close above the $78 resistance zone, which capped price two weeks ago, would open the door toward $90-$95. That range lines up closely with the 200-day EMA.
Failure to hold the wedge support near $73-$74 could send Solana price back down toward $68, with $60 as a deeper downside target.
Can AI Agents Drive Demand for Solana?
As per the tweet, Franklin Templeton, a $1.79 trillion asset manager, recently said agentic AI could become blockchain's biggest use case. The firm suggested this trend could drive fresh demand for SOL, since AI agents may need to submit SOL to record transactions on the network.
This is a longer-term narrative rather than a near-term price driver, but it adds another angle for investors tracking Solana's fundamentals.
Will Solana Price Go Up or Down Next?
SOL is at a crossroads. The Crypto Fear and Greed Index has climbed to 37, edging closer to neutral, which shows sentiment is slowly improving.
Yet the macro picture, thin ETF inflows, and a stubborn resistance zone near $78-$80 keep the near-term outlook uncertain. A decisive move above $80 could shift momentum toward $90 and beyond. A drop below $73 would likely reopen the path to $60.
Disclaimer
This article is for informational purposes only and does not constitute financial, investment, or trading advice. Cryptocurrency markets are highly volatile and risky. Prices can rise or fall sharply without warning. Always do your own research and consult a licensed financial advisor before making any investment decisions. Past performance is not indicative of future results.
Also read:

















