SpaceX Stock Falls Below IPO Price: What Happens to SPCX Next?

SpaceX stock slipped below its IPO price this week. The drop caught many traders off guard.
Just over a month ago, the company's market debut was one of the biggest in history. Now the mood has cooled fast.
Why did SpaceX stock fall below its IPO price?
SpaceX shares fell 1.7% to $134 on Wednesday, dipping below the IPO price $135 for the first time. This marked a fourth straight losing session for the stock.
At its peak in mid-June, SPCX stock hit an intraday high of $225.64. That level briefly pushed the company's market value above both Microsoft and Amazon.
Since then, the stock has slid roughly 40%. Reports suggest more than $1 trillion has been erased from SpaceX's market value in less than 30 days.
Elon Musk's 42% stake has also shrunk over the same stretch, falling from about $1.2 trillion to near $760 billion.
The wider stock market has not helped either. Investors are still working through the Federal Reserve's rate path and questioning how long the AI-driven rally can last.
What is the current SPCX stock price today?
As of the latest data, SPCX closed at $135.27, roughly flat on the day. The perpetual live price showed $136.06, up 0.55%.
The 30-minute chart shows SPCX stock trading well below its white descending trendline drawn from the June high. The 20, 50, 100, and 200 EMAs are all stacked above price, a sign of continued short-term weakness.
RSI on the 14-period reading sits near 36.60, close to oversold territory but not quite there yet.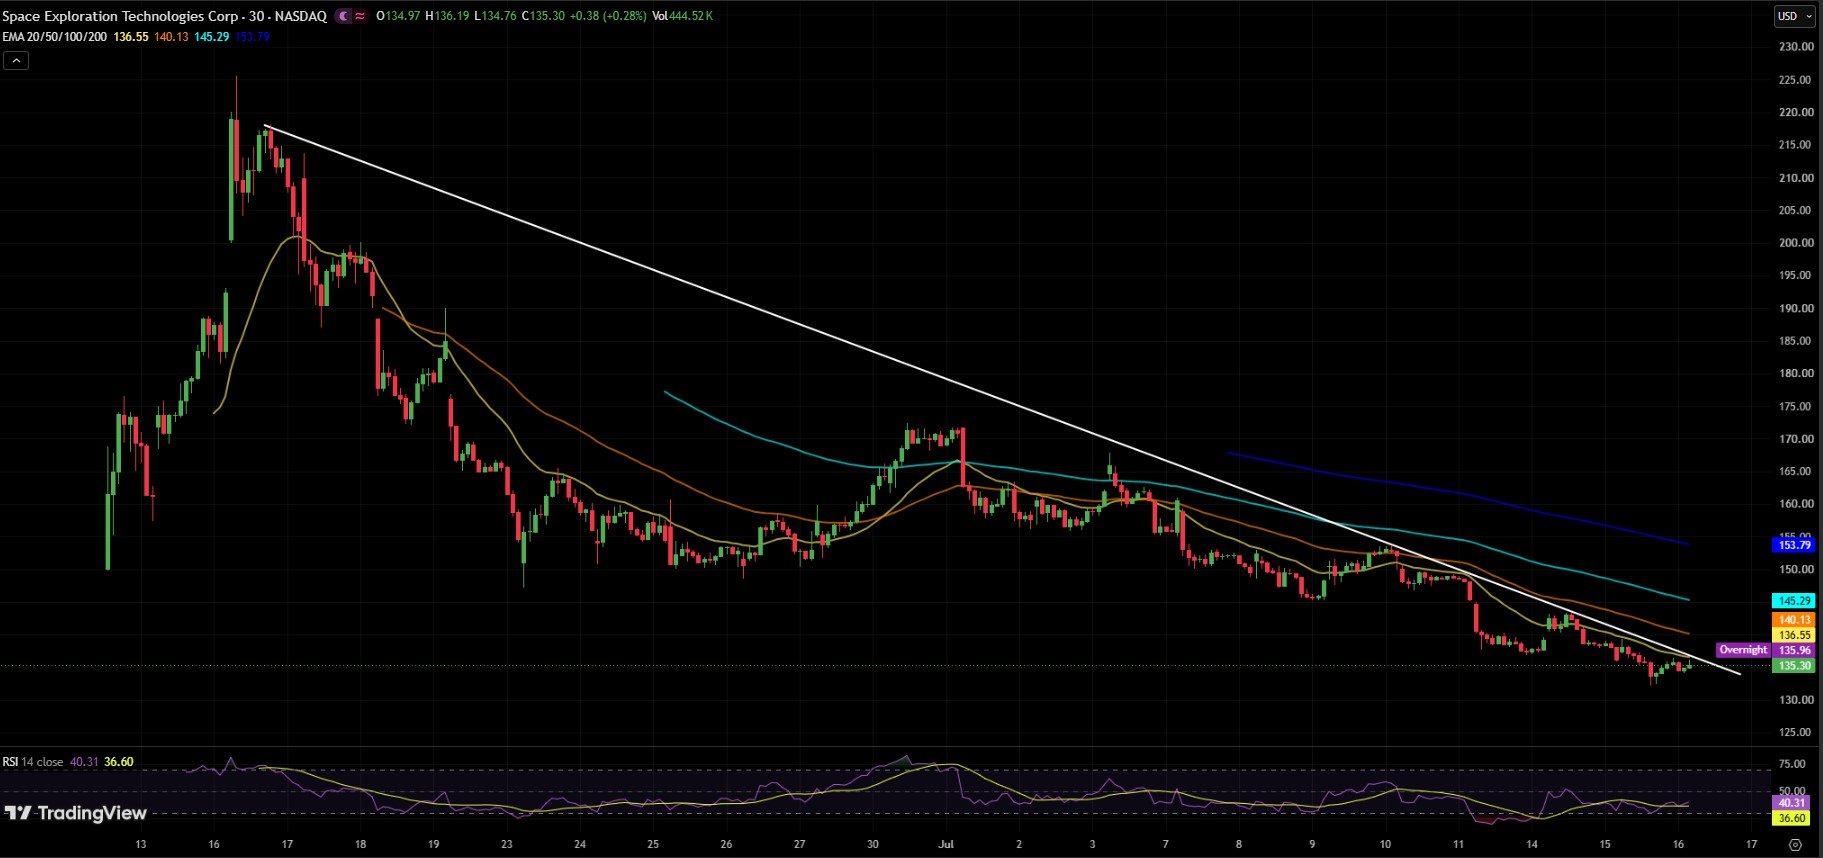
SpaceX stock trading and liquidation data
As per CoinGlass Liquidation Data, Trading activity remains heavy across major exchanges. Binance leads volume with $843.18 million, followed by OKX at $193.08 million and tradeXYZ at $185.01 million.
Liquidation Window | Total Rekt | Long Rekt | Short Rekt |
1h | $1.50K | $1.50K | $0 |
4h | $88.46K | $88.45K | $9.49 |
12h | $6.54M | $6.33M | $213.88K |
24h | $8.12M | $7.83M | $291.48K |
Long positions have taken the bulk of the losses over the past 24 hours, showing many traders were still betting on a bounce.
Long-short ratios also lean bullish, with Binance showing 5.4599 and OKX at 6.94, meaning more traders are positioned long than short right now.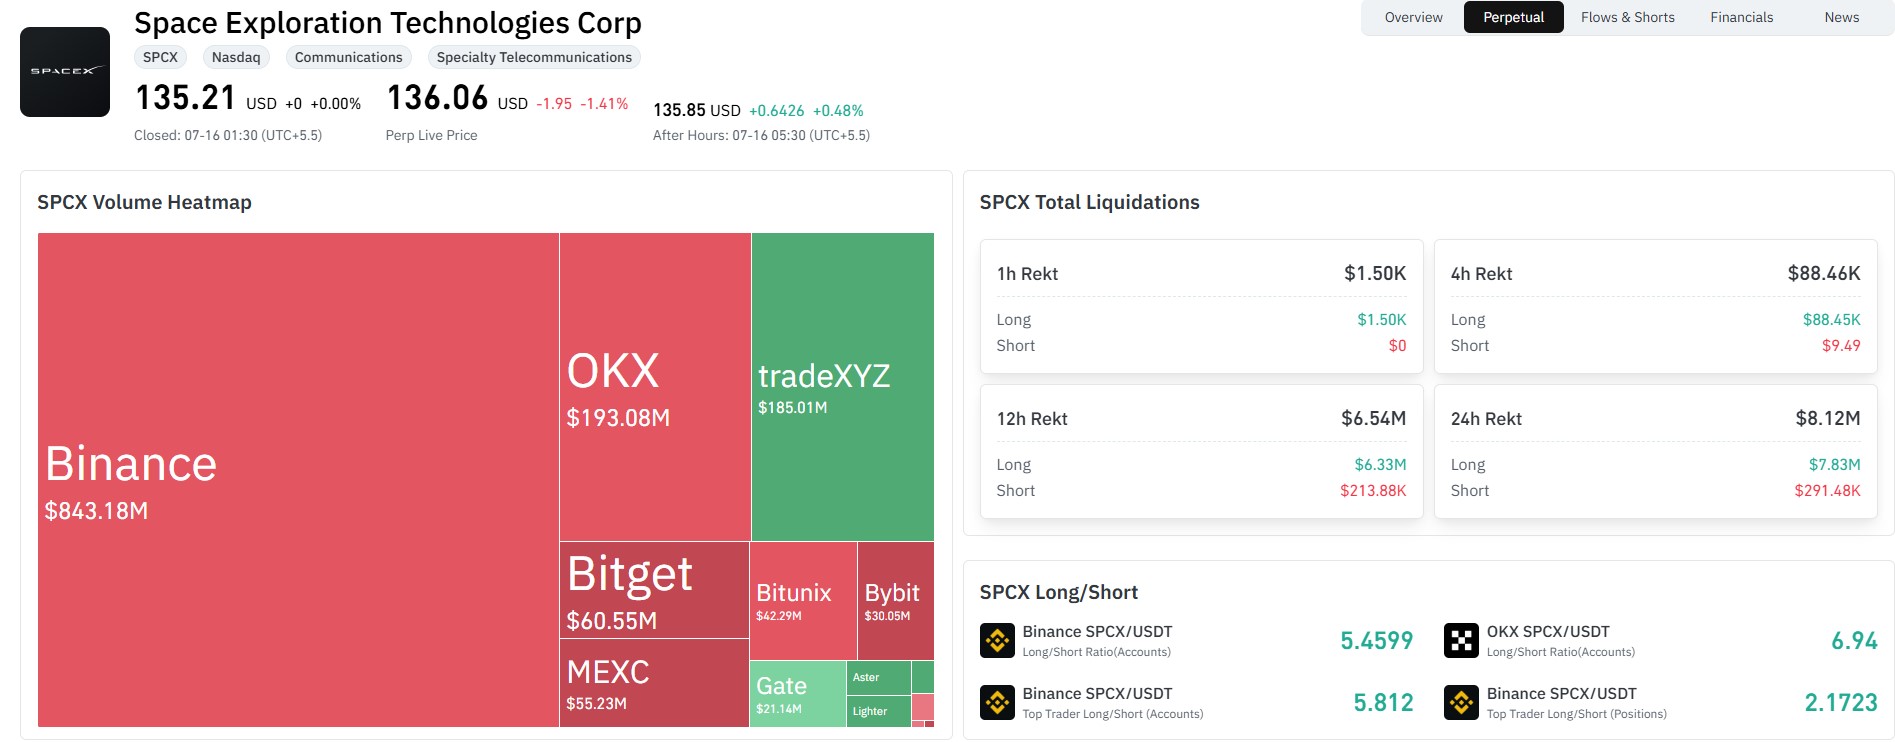
What are analysts saying about SpaceX stock price targets?
Morgan Stanley started coverage with an Overweight rating and a $300 price target, well above current levels.
The bank's model expects SPCX revenue to grow from about $45 billion in 2026 to $319 billion by 2030, and possibly $3.3 trillion by 2040.
Morgan Stanley also expects Starship's reusability to lower launch costs to around $500 per kilogram by 2030, and under $200 per kilogram by 2035.
Could SpaceX stock drop further?
Some traders are comparing this selloff to past tech stock crashes. Amazon fell 95% from its dot-com peak. Nvidia fell 90%. Apple fell 82%. Tesla fell 75% at one point.
Applying similar math to the SpaceX stock chart, a 70% drop from the $225 high would put shares near $67. An 80% drop would mean around $45.
These are just historical patterns, not a guaranteed outcome. SPCX stock could also stabilize if buyers step back in near current levels.
One trader on X compared the setup to Rocket Lab's 2020 debut, pointing to a similar path of IPO hype followed by a steep pullback. Their rough price path suggested moves between $85 and $160 before any recovery attempt.
When is the SpaceX stock earnings date?
SpaceX has not confirmed an exact date. Analysts widely expect the first public earnings report around August 6, 2026.
That date lines up closely with the end of the IPO lock-up period, when employees can start selling shares from compensation packages.
SpaceX stock unlock schedule 2026
A rough unlock schedule shared by a trader known as winkle on X lays out when more shares hit the market.
Unlock Date | Unlock Size | Cumulative Total |
Aug 11 | +20% | ~25% |
Sep 24 | +14% | ~39% |
Oct 25 | +14% | ~53% |
Nov 7 | +28% | ~60% |
The August 11 unlock is drawing the most attention since it lands right around earnings season, when added selling pressure could meet fresh scrutiny of the company's numbers as a public business.
Final thoughts on SpaceX stock
SpaceX stock is at an important level right now. It has broken below its IPO price, sits under every major moving average, and faces a heavy unlock calendar in the months ahead.
Long-term bulls point to Morgan Stanley's growth forecasts and Starship's cost curve. Short-term traders are watching support levels and the RSI for signs of exhaustion.
Nothing here is set in stone. Markets can move fast in either direction, especially around earnings and unlock dates.
Disclaimer
This article is for informational purposes only and should not be taken as financial advice. Stock and crypto markets are volatile and unpredictable. Always do your own research and consult a licensed financial advisor before making investment decisions. Past performance does not guarantee future results.
















