SpaceX Stock Price Prediction: Can SPCX Hit $150 or Fall to $75?


SpaceX stock (SPCX) closed at $136.97 on Friday, up about 2.22% on the day. The stock is holding above its IPO price of $135, but it is still about $13 away from the $150 level that traders are watching closely.
The move comes just days after SpaceX's first insider unlock, and another one is already on the calendar for September.
What is SpaceX stock (SPCX) trading at right now?
The stock closed near $136.97 after bouncing off support around $130. The stock has spent the last few sessions consolidating in the $134 to $140 range.
On the hourly chart, price is sitting right on top of its 20, 50, 100, and 200 EMAs, which are all bunched close together. That usually means the market is picking a direction soon, not just drifting.
A descending trendline near $138 to $140 has capped rallies for weeks. Every time SPCX pokes above it, sellers show up.
Why does $150 matter so much for SPCX?
As per the analyst, the SpaceX stock analysis's Fibonacci setup has flagged $150.98 as a key 0.382 retracement level. It also lines up with a measured move target from the stock's prior swing.
SPCX has not tested $150 yet. It would first need to clear the closer $138 to $140 resistance zone before making a run at it. If it eventually breaks and holds above $150, the bearish case mostly falls apart, and traders following the setup would look toward $160 to $180 as the next zone.
If the stock gets rejected below $150 instead, the same chart points to a slide back toward $130, then $120, and eventually the $100 area if selling picks up.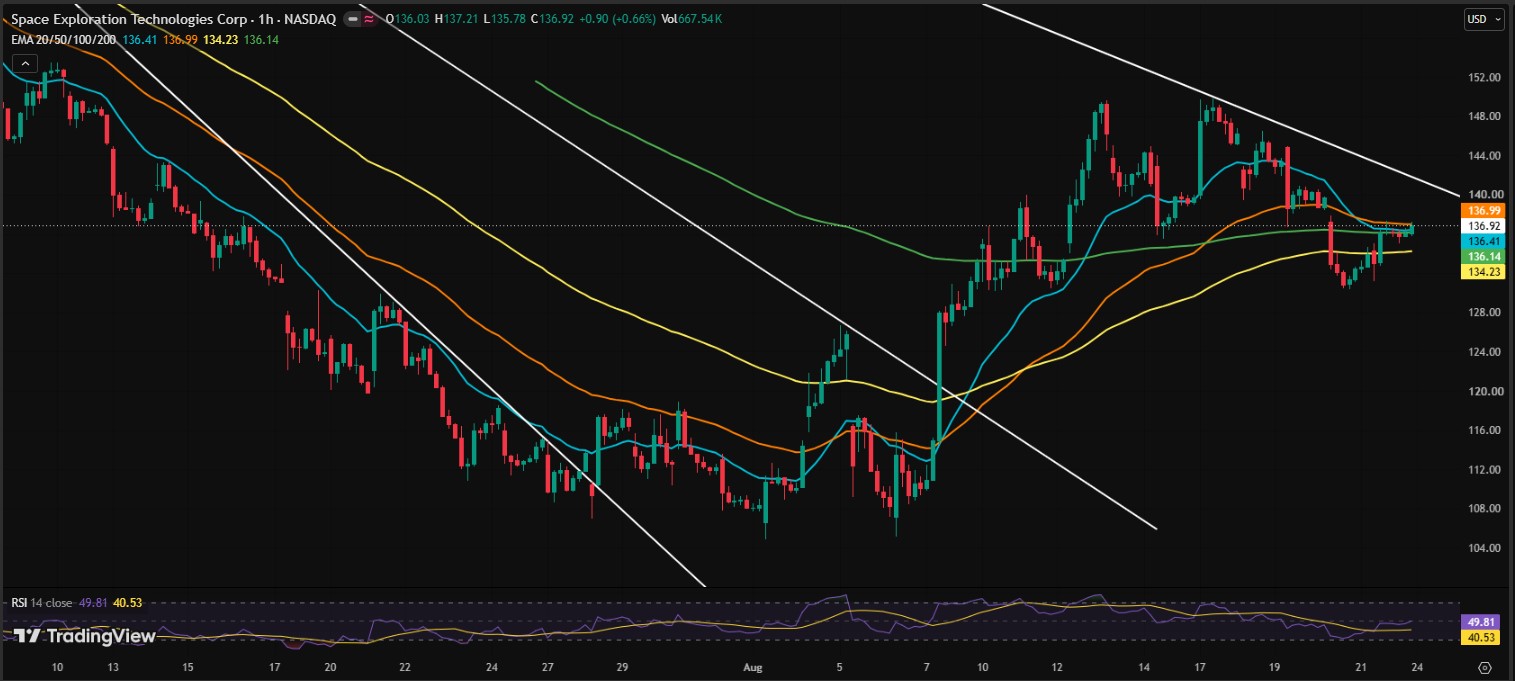
What is the bearish target for SpaceX stock?
The deeper bearish target on the chart sits near $75, based on a Fibonacci extension and a repeat of the drop pattern seen after the stock's all-time low near $104.85.
That $75 level would mark roughly a 45% drop from Friday's close. It is not a call that this will happen, just the level the chart points to if support keeps breaking.
For that scenario to play out, the chart needs a retest of the old low, a bounce, a rejection, and then a fresh lower low. None of those four steps have happened yet.
Level | Price | What it means |
Major resistance | 150–152 | Bull/bear decision point |
First support break | 120–130 | Confirms downside if $150 rejects |
Mid support | 100–105 | Key floor from prior low |
Acceleration zone | 80–85 | Only if $100 breaks |
Deep bear target | ~$75 | Theoretical chart low |
What are traders on Polymarket betting on SPCX?
Prediction market data adds another layer here. On Polymarket, traders are pricing a 67% chance SPCX closes above $130 by the end of August.
The odds drop to 40% for a close above $140, and just 20% for above $150. That gap shows confidence fading fast as price nears the bigger resistance zone.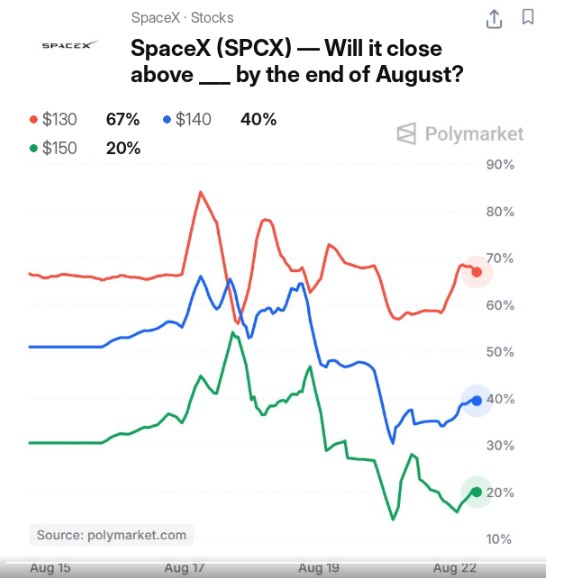
What is driving SpaceX stock news this week?
A few things are moving the stock beyond the chart itself.
Cathie Wood's ARK Invest bought 205,031 $SPCX shares on Friday across four of its ETFs, worth about $27.4 million. Most of that went through the ARKK fund.
SpaceX also has a launch scheduled from Vandenberg Space Force Base, sending 27 Starlink satellites into orbit on a Falcon 9 rocket early Saturday.
On top of that, SpaceX confirmed the Starship vehicle for its fourteenth flight test completed a full 60-second static fire with all six Raptor engines. That is another sign the company's core rocket program is moving forward, even as the stock chart stays choppy.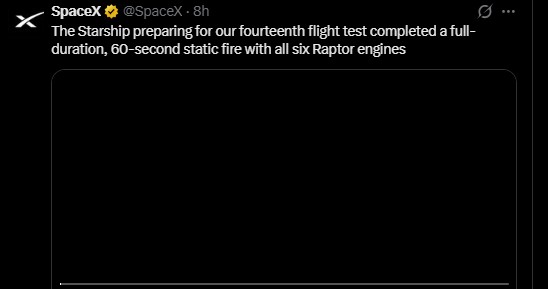
On the dilution side, a second insider unlock of roughly 319 million shares is set for September 9. SpaceX's $60 billion all-stock deal to acquire Cursor also added around 389 million new Class A shares, which adds more supply to the market.
There is also a bigger valuation question in the background. Reports suggest Anthropic could pursue an IPO that rivals or beats SpaceX's own $75 billion raise, with talk of a valuation near $2 trillion. That kind of comparison could pull investor attention and capital away from SPCX in the short term.
SPCX price prediction: bull case vs bear case
Bull case: SPCX breaks and holds above $140, then clears the $150 resistance. That would open the door to $160 to $180, invalidating the deeper bearish setup.
Bear case: SPCX fails again at $138 to $140, loses support near $130, and drifts toward the $100 to $120 zone. A break below $100 would put the $75 target back in play.
Right now, the RSI is sitting near 50, which points to a neutral market with no strong momentum either way. The next big move likely depends on whether buyers can push through resistance or sellers take control below current support.
Disclaimer
This article is for informational purposes only and does not constitute financial, investment, or trading advice. Stock prices are volatile and can move sharply in either direction. Prediction market odds and technical chart levels reflect current sentiment, not guaranteed outcomes. Always do your own research and consult a licensed financial advisor before making investment decisions.
Also read:











.webp)





