Zcash Price Prediction: Can ZEC Clear $1,000 After Breakout?


Zcash just did something most privacy coins have not managed in years. It broke out to a fresh high on a volume spike that traders are still talking about, and the Zcash price prediction conversation has shifted overnight.
With an ETF filing also back in the news, ZEC is suddenly one of the more watched charts in the market this week.
The levels below are based on the 1-day ZEC/USDT perpetual chart and should be rechecked if the price closes meaningfully outside the stated range.
Table of Contents
ZEC Price Right Now
Zcash ETF Filing: What the New Grayscale Update Means
Zcash Holder Concentration Snapshot
ZEC Liquidation Data Today
Zcash Trend and Momentum: Key Takeaways
ZEC Price Prediction: Daily Chart Analysis
Technical Outlook Snapshot
Support and Resistance Levels to Watch
Risk-Reward Table
Invalidation Level
How Bitcoin Could Influence ZEC
Planned Update
Glossary
CoinGabbar's Technical Analyst View
Disclaimer
ZEC Price Right Now
Metric | Value |
CMP (ZEC/USDT Perpetual) | $818.80 |
24h Change | +42.76% |
Market Cap | $13.94B |
Futures Volume (24h) | $8.08B |
Spot Volume (24h) | $970.19M |
Open Interest | $1.68B |
Circulating Supply | 16.83M ZEC |
Total Supply | 16.83M ZEC |
Max Supply | 21.00M ZEC |
Open interest sitting at $1.68B against a $13.94B market cap shows leveraged positioning has grown fast alongside the spot move, which is one reason the short-side liquidation numbers below are so heavy.
Futures volume of $8.08B versus spot volume of $970. 19M also confirms this rally is being driven mostly by derivatives traders rather than pure spot accumulation.
Chart source: TradingView, ZEC/USDT Perpetual, 1-Day timeframe, Binance, captured August 22, 2026, 09:35 AM IST. Data source: CoinGlass, captured August 22, 2026.
Methodology and Data Sources
This Zcash price prediction is built strictly from the 1-day ZEC/USDT perpetual chart on Binance along with the price levels marked on that chart, CoinGlass market and liquidation data, and CoinGlass holder concentration data.
No external analyst targets or invented indicator readings are used anywhere in this piece.
Zcash ETF Filing: What the New Grayscale Update Means
Fresh news is adding fuel to the ZEC coin price prediction narrative.
According to Wu Blockchain, Grayscale has submitted its fifth revised filing for the Zcash Trust with the US SEC, moving the existing Grayscale Zcash Trust closer to becoming a spot Zcash ETF.
The filing states the trust would be renamed The Zcash ETF and would list on NYSE Arca under the ticker ZCSH, with Coinbase Custody Trust Company acting as custodian and BNY Mellon serving as transfer agent and administrator.
A fifth revision generally signals the SEC is actively working through the filing rather than sitting on it, which is a mildly bullish structural signal even though it says nothing about approval timing.
Source: Wu Blockchain (X/Twitter), August 22, 2026, 3:24 AM.
Zcash Holder Concentration Snapshot
The on-chain picture shows this rally is happening inside a very concentrated holder base.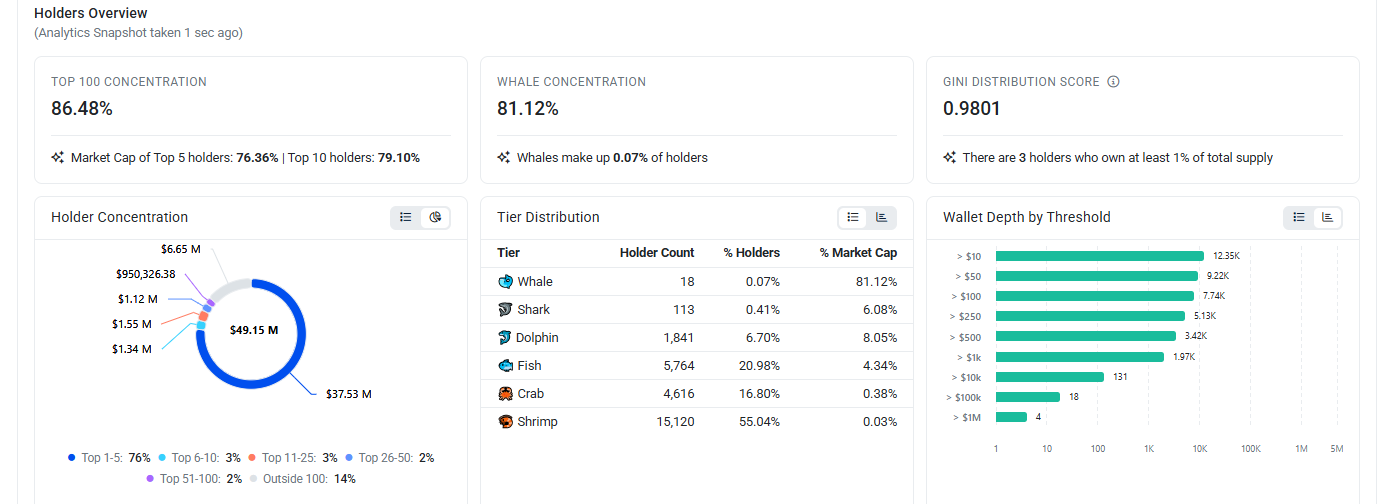
Top 100 wallets control 86.48% of supply, and whale wallets alone, just 0.07% of all holders, account for 81.12% of market cap.
The Gini distribution score sits at 0.9801, and only 3 wallets hold at least 1% of the total supply each.
This level of concentration means large wallet movement can swing the price sharply in either direction, so it is worth watching alongside the technical levels rather than in isolation.
Source: CoinGlass Holders Overview, captured August 22, 2026.
ZEC Liquidation Data Today
Short-side liquidations are dominating every single window, running well above long-side wipeouts at every timeframe.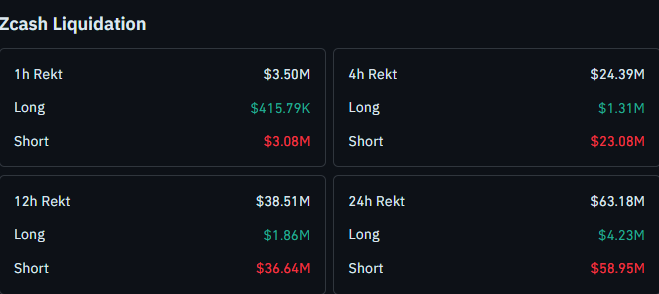
That pattern typically shows traders positioned for a pullback getting forced out as price kept pushing higher, which lines up with the sharp breakout move on the chart. Source: CoinGlass, captured August 22, 2026.
Zcash Trend and Momentum: Key Takeaways
ZEC broke above its previous high on a large volume spike, printing a Fresh high at $860.28
The current price is trading at $818.80, just below that new high, with the old swing high zone now acting as potential support
A sustained move above the $775.75 to $687.27 zone keeps the broader structure bullish
$1,000 stands out as the next major psychological resistance, followed by $1,350 as a measured resistance level
Short-side liquidations are heavily outweighing long-side liquidations across every timeframe, from 1 hour out to 24 hours
A fresh Grayscale ETF filing update is adding a fundamental tailwind alongside the technical breakout
This is a fast-moving, highly leveraged setup. Price can reverse quickly against either side, so these levels should not be treated as guaranteed outcomes.
ZEC Price Prediction: Daily Chart Analysis
ZEC has just done what a lot of traders wait months for.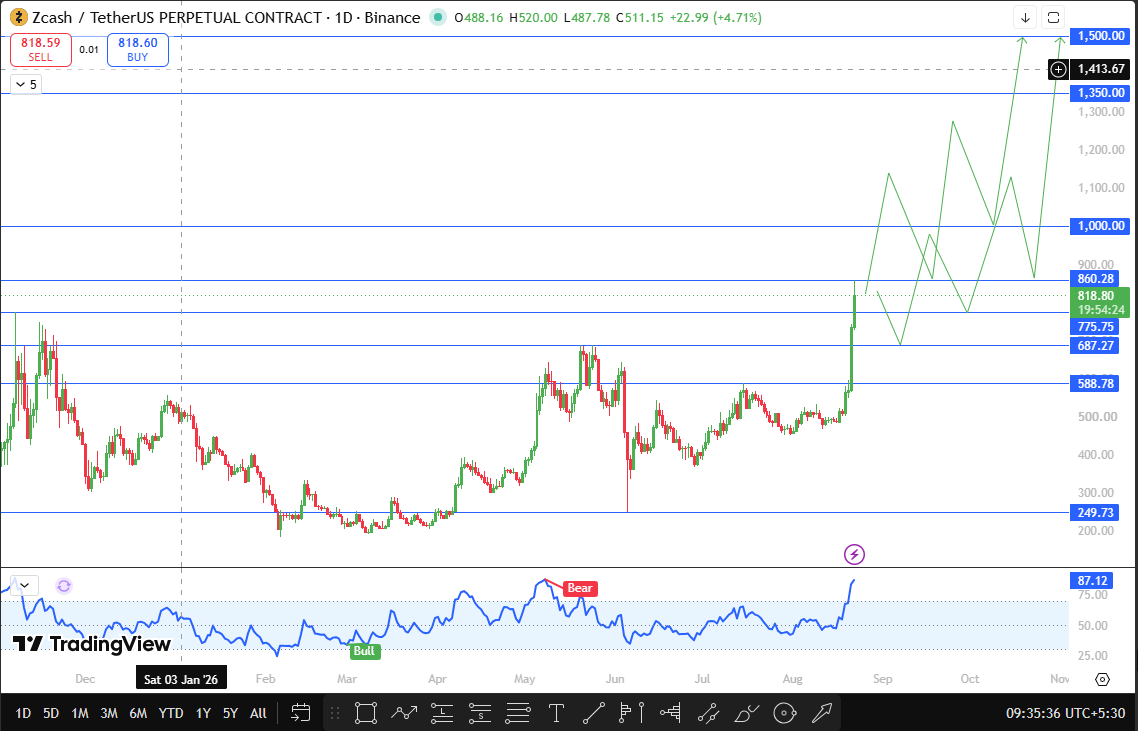
It broke out above its prior high with a volume candle large enough to stand out clearly on the daily chart, pushing to a new high of $860.28 before settling back toward $818.80.
A small pullback toward the old swing high zone would not be unusual here.
That old swing high area is exactly the kind of level that tends to flip from resistance into support once price has broken above it, and that is the read on this move.
As long as ZEC holds the $775.75 to $687.27 zone on a closing basis, the breakout structure stays intact.
The next real test sits at $1,000. It is a round number, which makes it psychologically significant on its own, but it will also need volume behind it the same way the breakout did.
A close above $1,000 with strong participation opens the door toward $1,350, a level that stands out as a measured resistance target based on the size of the recent breakout move.
Beyond that, $1,500 is the next psychological round number in play.
None of this rules out chopping along the way. Given how far and how fast ZEC has already moved, some sideways consolidation or a retest of the breakout zone before any push to $1,000 would be a normal part of this structure playing out.
Technical Outlook Snapshot
Indicator | Reading | Signal |
Price Structure | New high breakout at $860.28 | Bullish |
Momentum Oscillator (TradingView Bull/Bear tag) | 87.12, tagged Bull | Bullish |
Volume on Breakout | Sharp spike on breakout candle | Bullish |
Short-Side Liquidations (24h) | $58.95M vs. $4.23M long side | Confirms squeeze higher |
Immediate Support Zone | $775.75 to $687.27 | Key zone to hold |
Support and Resistance Levels to Watch
Type | Level | Note | % From CMP |
Resistance | $1,500 | Psychological round number | +83.20% |
Resistance | $1,350 | Measured resistance target | +64.87% |
Resistance | $1,000 | Major psychological resistance | +22.14% |
Resistance (extended) | $1,413.67 | Chart-marked projection level | +72.68% |
Resistance | $860.28 | Fresh high | +5.07% |
Current Price | $818.80 | CMP | 0% |
Support | $775.75 | Old swing high, now potential support | -5.26% |
Support | $687.27 | Key support, chart-marked swing low | -16.06% |
Support | $588.78 | Chart-marked deeper support | -28.10% |
Case | Trigger | Target |
Bull Case | Sustained hold above the $775.75 to $687.27 zone | $1,000, then $1,350, then $1,500 |
Base Case | Consolidation between $687.27 and $860.28 | Range-bound before next directional move |
Bear Case | Breakdown and close below $687.27 | Retest of $588.78 support |
Setup Invalidation | Sustained close below $687.27 | Bullish structure weakens |
Invalidation Level
No specific downside invalidation level was given verbally for this setup, but based on the chart-marked support levels, a sustained daily close below $687.27 would be the level that weakens the current bullish structure, opening room toward the $588.78 support marked further down on the chart.
Until that happens, the pullback-to-support read stays the operative view.
How Bitcoin Could Influence ZEC
Bitcoin's broader trend still sets the tone for risk appetite across leveraged altcoin pairs like ZEC, especially with open interest as elevated as it currently is on Zcash.
A stable or rising Bitcoin generally gives coins like ZEC more room to test resistance levels like $1,000, while a sharp Bitcoin selloff tends to accelerate downside moves on high open interest pairs regardless of a coin's own structure.
Planned Update
This piece will be revisited if ZEC closes a daily candle above $1,000 or below $687.27, whichever comes first, or if the Grayscale Zcash ETF filing sees a material update from the SEC.
Glossary
CMP: Current market price, the live trading price at the time of publication
Open Interest: The total value of outstanding, unsettled derivative contracts on an asset
Perpetual Futures: Futures contracts with no expiry date, allowing traders to hold leveraged long or short positions indefinitely
Liquidation: The forced closing of a leveraged position when losses exceed the trader's margin
Gini Distribution Score: A measure of wealth concentration among holders, where a score closer to 1 indicates higher concentration
CoinGabbar's Technical Analyst View
Bull Case: ZEC's breakout above its prior high on strong volume, combined with heavy short-side liquidations and a fresh ETF filing update, points to continuation toward $1,000 and eventually $1,350 if the $775.75 to $687.27 zone holds as support.
Base Case: Some consolidation or a retest of the breakout zone near the old swing high would be a healthy pause after such a fast move, without breaking the larger bullish structure.
Bear Case: A sustained close below $687.27 would undercut the support zone and shift focus back toward $588.78, delaying any test of $1,000 in the near term.
Disclaimer
This article is for informational purposes only and should not be considered financial or investment advice. Cryptocurrency markets, particularly leveraged derivatives, are highly volatile and carry substantial risk of loss. CoinGabbar and the author do not hold a position in ZEC at the time of publication. Readers should conduct their own research and consult a qualified financial advisor before making any investment decisions.
Also read:











.webp)





