Stellar Price Prediction: Can the Q2 Update Shift XLM's $0.17 Setup?


Stellar is about to put its Q2 numbers, partnership updates, and milestones in front of the market, and it's doing so while XLM trades near $0.17 after a sharp short-term slide.
That timing is the real story behind this Stellar Price Prediction: a network preparing to show its progress, arriving right as the token backing it looks technically stretched.
What Could Stellar's Q2 Update Mean for XLM?
The Stellar Development Foundation has been promoting its Q2 2026 report ahead of a webinar scheduled for Thursday, July 30, at 3 PM ET / 12 PM PT. CEO Denelle Dixon will be joined by José Fernández da Ponte, Tomer Weller, and Raja Chakravorti to walk through the quarter's numbers and milestones.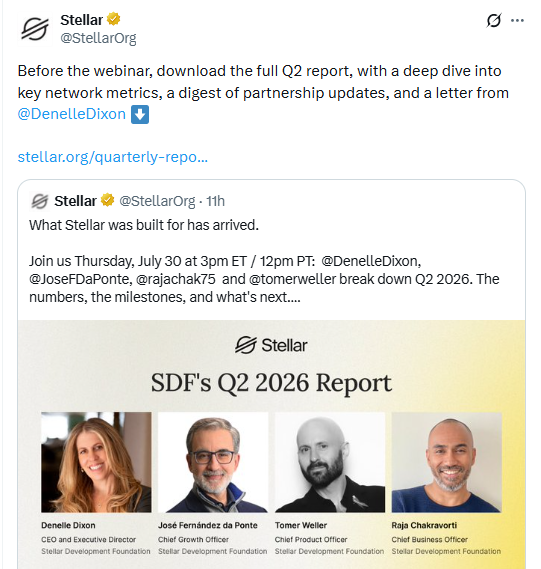
The report itself is described as including a deep dive into key network metrics, a digest of partnership updates, and a letter from Dixon.
For anyone following the network, that's a legitimate opportunity to see how Stellar's business is actually progressing.
But a quarterly review of metrics and partnerships doesn't automatically translate into new demand for XLM the token, and it doesn't change circulating supply either.
Network progress and token price can move on different timelines, and this update is worth watching as a fundamental data point rather than a guaranteed price catalyst.
What Is the Daily Chart Showing for Stellar?
Zoom out to the daily chart and XLM is still living in the shadow of a sharp move in late May, when price spiked to a high above $0.28. Much of that surge has since been given back, with a descending trendline forming off that peak and capping subsequent recovery attempts.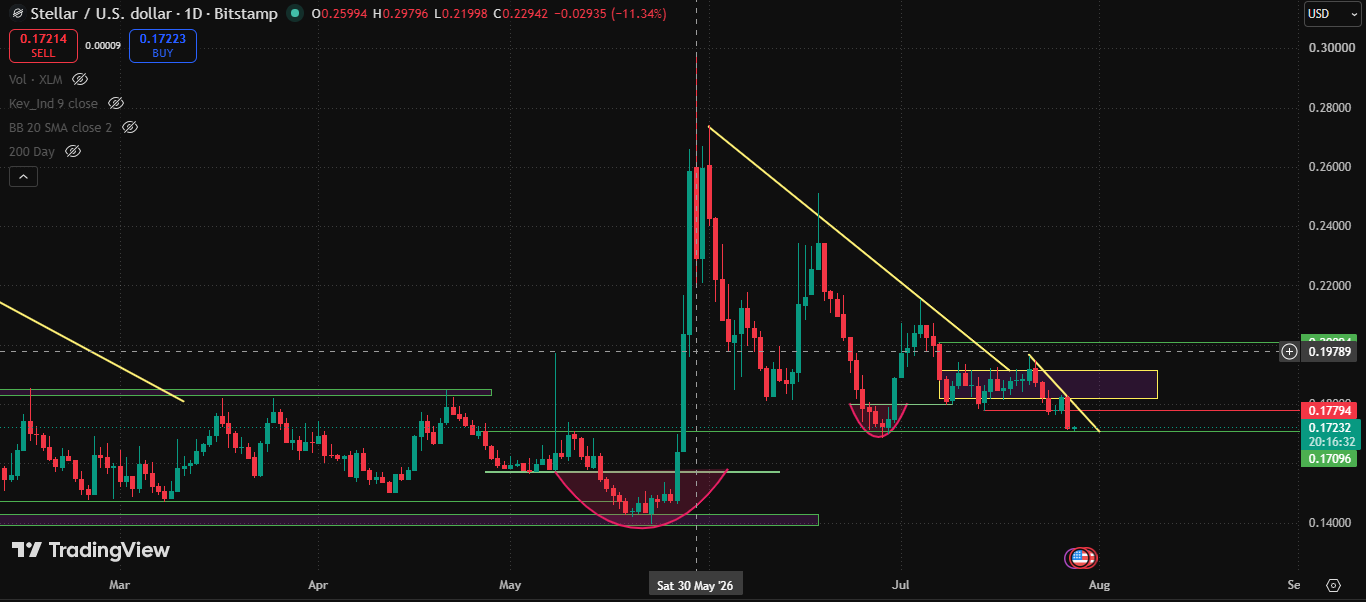
A period of consolidation through June and July never produced a sustained breakout above that trendline, and price has drifted back down toward the same $0.17 region it traded near before the spike. A larger recovery hurdle remains marked near $0.20094, well above where XLM sits today.
How Is Stellar Trading on the 4-Hour Chart?
As per the 4-hour TradingView chart. fills in the near-term picture. XLM spent recent weeks consolidating in a range, but that range has broken down, with price now trading around $0.1722.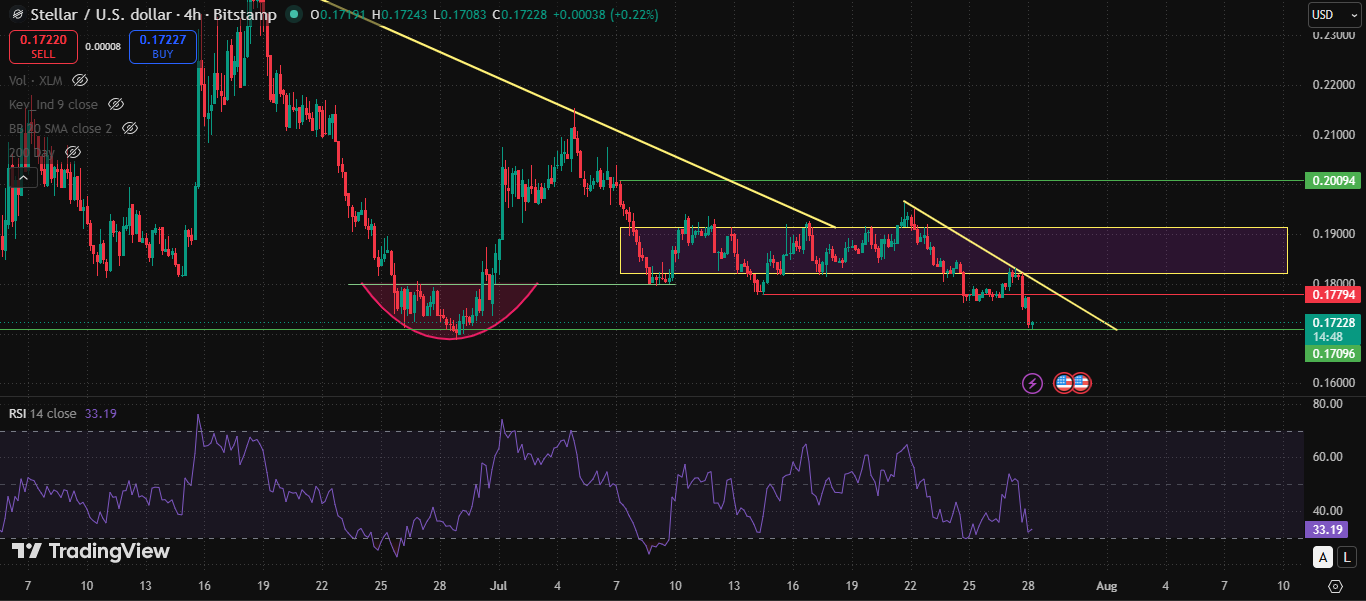
The former lower boundary of that range, near $0.17794, sits just above current price rather than beneath it, and the next visible support is closer to $0.17096. Above the market, a supply zone spans roughly $0.182 to $0.191.
Short-term RSI reads 33.19, which is approaching oversold territory without actually reaching it.
That reading reflects stretched momentum after the recent decline, not a signal that a bounce is imminent.
What Are Stellar's Derivatives Metrics Signaling?
Funding on XLM perpetuals has turned negative, near -0.0183% at the latest reading, meaning short positions are currently paying to stay open.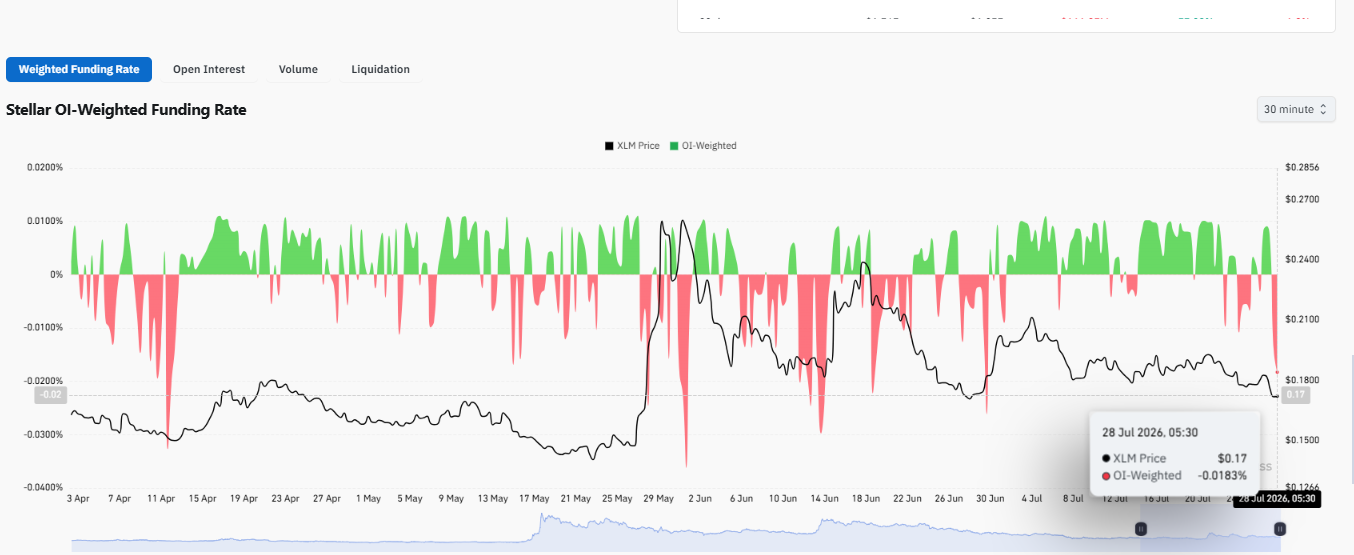
Open interest sits around $163.29M, still elevated compared with levels seen before a sharp expansion in late May, even after cooling off its peak.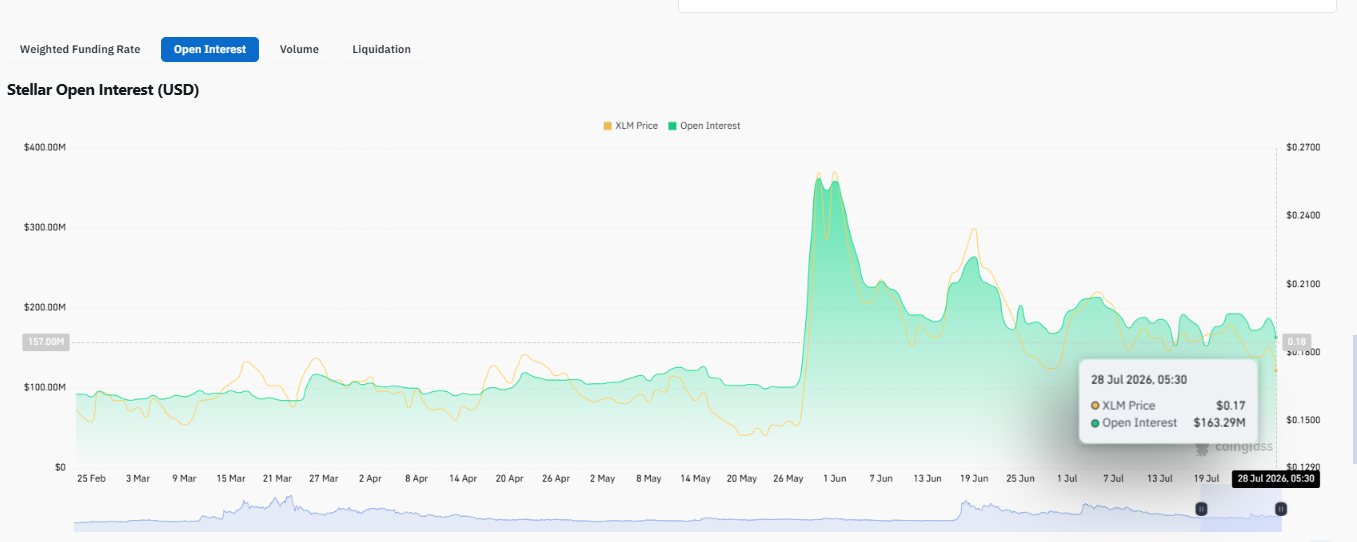
Positioning across exchanges doesn't tell one clean story. Binance's overall XLM/USDT account ratio reads 0.866, leaning short, while OKX's account ratio sits at 1.66, leaning long.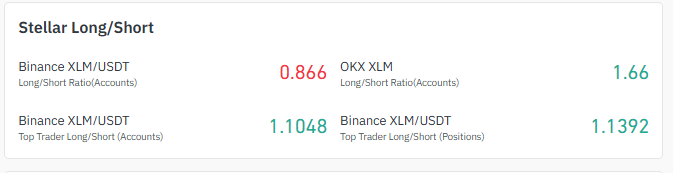
Binance's top traders lean long too, both by account count at 1.1048 and by position size at 1.1392. That's disagreement, not consensus.
Liquidation data adds another layer. Over the past 24 hours, longs accounted for roughly $1.38M of losses against about $56.95K on the short side, and the 12-hour window shows the same imbalance, with $783.08K in long liquidations compared to just $93.97 on shorts.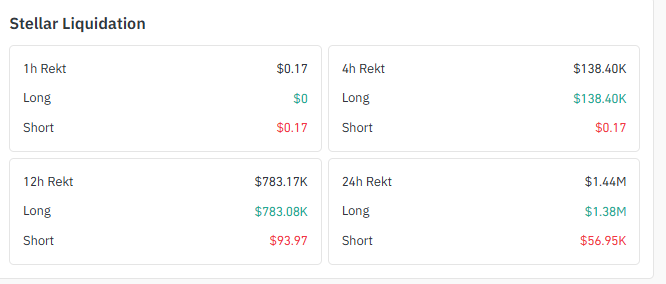
Leveraged longs have clearly absorbed most of the recent pain, though that alone doesn't confirm the selling is finished.
Futures activity remains spread across several venues, with Binance showing the largest visible share alongside meaningful volume on MEXC, Bybit, and OKX.
Source: Stellar data on CoinGlass as of July 28, 2026. Figures may vary slightly across other tracking websites
How Has Stellar Performed Across Timeframes?
The short-term numbers are rough, with XLM down roughly 5% over 24 hours and 8.55% over the past week.
Zoom out to 30 and 90 days and the picture softens, with the 30-day change nearly flat at -0.86% and the 90-day figure still positive at +6.45%.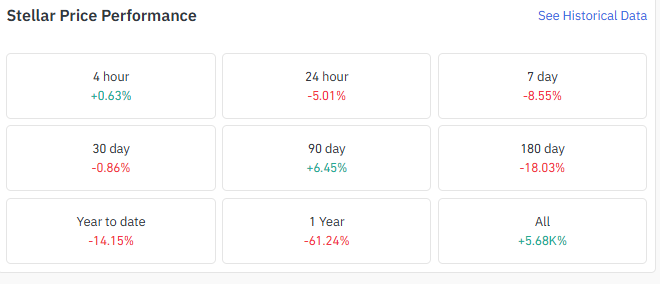
Stretch further and the weakness returns, with the 180-day change at -18.03%, year-to-date at -14.15%, and the one-year figure down 61.24%. The recent slide sits inside a longer stretch that's been mixed rather than uniformly bad.
Stellar Price Prediction: What Happens Next?
As per CoinGabbar's analysis, this Stellar Price Prediction comes down to three realistic paths.
In the bullish scenario, XLM holds around $0.17 and recovers the former $0.178 range boundary, which would be the first real sign the breakdown is losing force.
From there, the supply zone described earlier becomes the next test.
In the bearish scenario, a decisive loss of the $0.17 area would reinforce the current downtrend and open the door to further weakness, though nothing in the current setup points to a specific lower target.
The neutral scenario is just as plausible: XLM holds near $0.17 but can't reclaim the lost range boundary, leaving it stuck in a sideways consolidation rather than resolving in either direction.
Given negative funding, divided positioning, heavy long liquidations, and stretched short-term momentum, none of the three outcomes is confirmed yet, and the upcoming Q2 update adds a fundamental variable to a setup that's already unsettled.
Conclusion
Stellar's Q2 report gives the network a chance to make its case on fundamentals, but XLM's chart still needs to answer its own question first.
Whether $0.17 holds as support or gives way will likely matter more to price in the near term than anything in the update itself.
Traders are watching both at once, with neither side confirmed.
Disclaimer: This article is for informational purposes only and does not constitute financial advice. Cryptocurrency markets are volatile; conduct your own research before making investment decisions.