SUI Price Prediction July 2026: $SUI Next Big Explosion


SUI has been building toward this moment for weeks, and the chart is finally forcing the question everyone's been avoiding: does this breakout actually happen, or was the recovery just a bounce inside a bigger downtrend?
Here's what the daily and 4-hour charts, liquidation data, and exchange volume show right now and what it would take to confirm either outcome.
Where SUI Sits Right Now
$SUI is trading around $0.7358, after the daily candle opened at $0.7401, ran as high as $0.7426, and dipped to a low of $0.7350, down 0.57% on the day.
Sui price prediction July 2026: Price is coiling in an increasingly tight range rather than showing a clean trend in either direction.
Levels below reflect this snapshot; if the price moves meaningfully past either boundary, treat the numbers as due for a refresh.
SUI Coin News: Privacy Becomes a Priority
Away from the charts, Mysten Labs co-founder Adeniyi Abio said in comments reported by Crypto Banter.
That privacy is essential for on-chain payments and finance to reach mass adoption and that bringing confidential transactions to the SUI mainnet is now a top priority for the team. 
It's a longer-term adoption narrative, not something that moves this week's resistance test, but it's worth tracking as a separate fundamental catalyst.
This sentiment read is current as of mid-July 2026 and should be revisited once Mysten Labs shares a concrete rollout timeline.
SUI Whale Liquidations: A Fight With No Clear Winner Yet
As per Coinglass liquidation data dashboard reviewed for this piece (data as of July 18, 2026), the liquidation numbers show a market pulling in both directions depending on the window.
Over the last hour, $312.15 was liquidated, all of it from long positions. Over four hours, $2.28K was wiped out, again entirely long.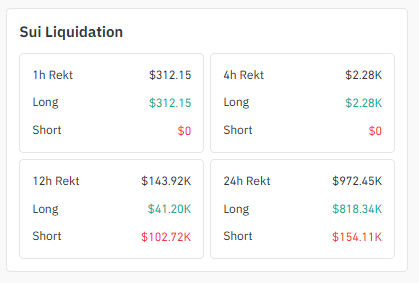
Zoom out to 12 hours, though, and it flips: $143.92K total, with $102.72K coming from shorts versus just $41.20K from longs.
Over the full 24 hours, the total climbs to $972.45K, with longs taking the bigger hit at $818.34K against $154.11K in short liquidations.
That's genuinely useful information, not just noise. A resistance test that wipes out one side cleanly tends to resolve in that side's favor.
But SUI's liquidations have swung both ways with the 24-hour window, which is a decent sign that neither buyers nor sellers have full control of this breakout attempt yet.
Exchange Volume Heatmap: Binance Still Runs the Show
Per the exchange volume heatmap reviewed for this piece (futures volume, data as of July 18, 2026), Binance carries the largest share of SUI futures volume by a wide margin at $100.33M, followed by MEXC at $60.79M. 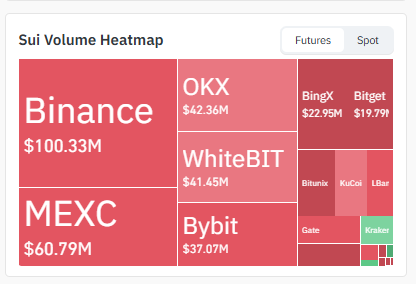
OKX ($42.36M) and WhiteBIT ($41.45M) sit close together in the next tier, with Bybit ($37.07M), BingX ($22.95M), and Bitget (around $19.79M) rounding out the mid-tier exchanges. Bitunix, KuCoin, LBank, Gate, and Kraken split the remaining volume in smaller amounts.
Because Binance carries such a dominant share, a genuine breakout should show up there first; a move that only appears on smaller exchanges is worth treating with extra caution.
$SUI Coin Forecast: 4H Structure Remains Inside the Rising Channel
On the 4-hour chart, SUI is riding a rising channel, currently sitting at the lower boundary of $0.7375.
The channel's upper boundary sits at $0.7833, and a clean break above it with volume opens a path to $0.8196. 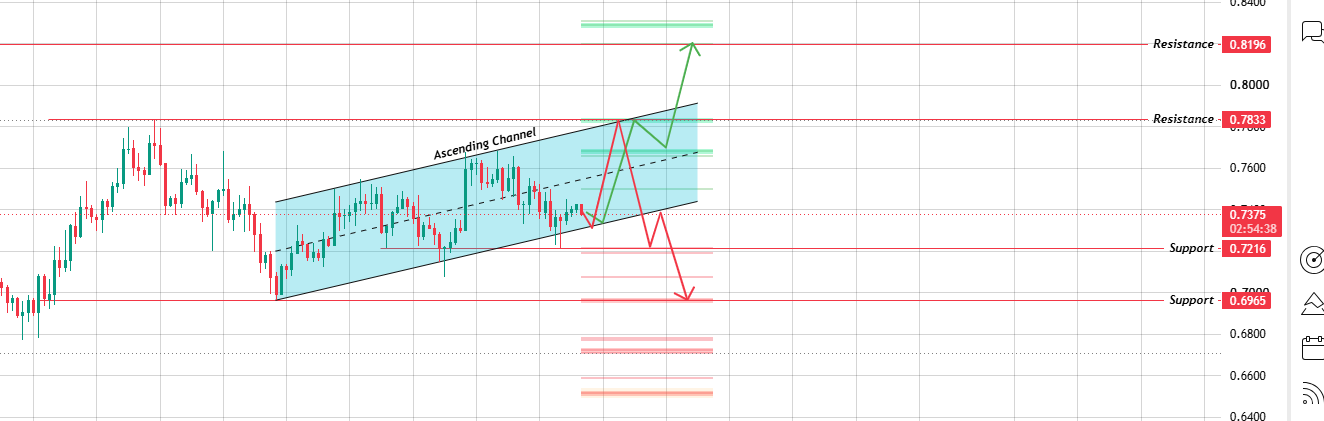
On the downside, $0.7216 is the first level to watch. $0.6965 marks the channel's lower boundary; losing that would effectively invalidate the rising-channel structure and would also put the daily triangle's $0.6964 support under immediate pressure.
| 4H Level | Price | Importance |
|---|---|---|
| Resistance 2 | $0.8196 | Breakout target above the channel |
| Resistance 1 | $0.7833 | Channel's upper boundary |
| Support 1 | $0.7216 | Immediate support |
| Support 2 | $0.6965 | Channel floor, structure invalidation |
SUI Price Prediction: Daily Chart Coiling Into a Symmetrical Triangle
On the 1-day chart, $SUI has been carving out a symmetrical triangle, a falling trendline connecting the highs and a rising trendline connecting the lows, both converging toward the same point.
Unlike a rising or falling channel, this pattern doesn't lean bullish or bearish on its own; it's a squeeze, and price is currently sitting right near the apex where the two trendlines meet.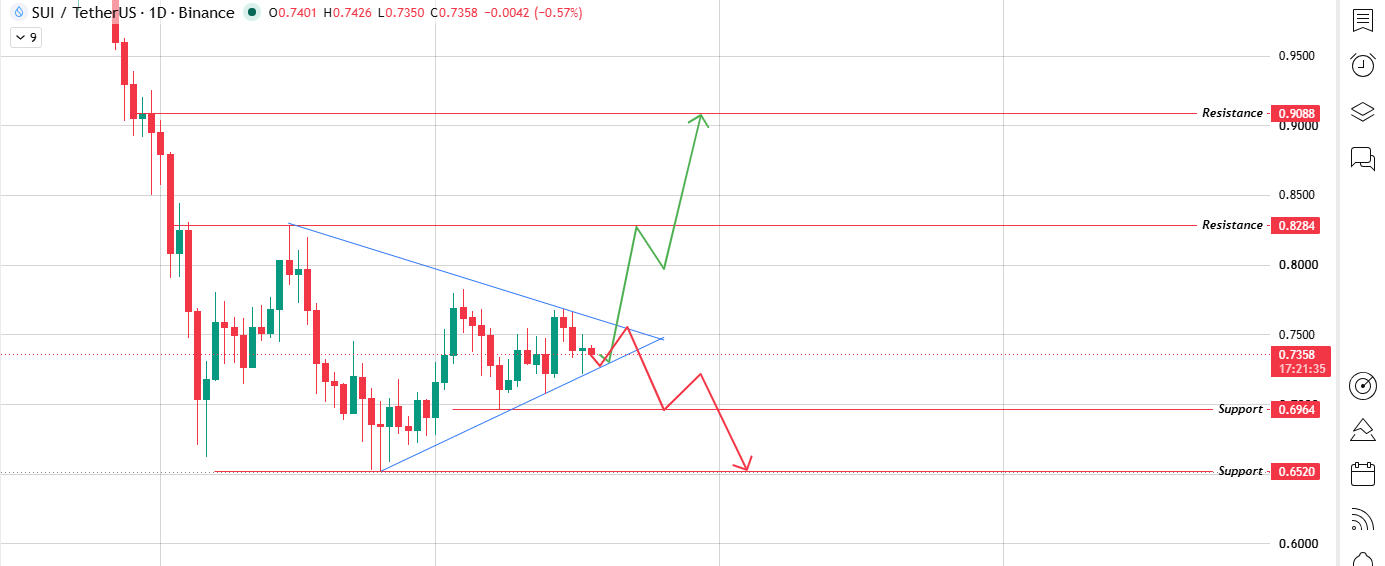
That tightness matters: the longer a triangle compresses before breaking, the sharper the eventual move tends to be.
If SUI closes a full day above the triangle's upper trendline, the first target is $0.8284. Clear that with real momentum, and $0.9088 comes into range.
If the price breaks down through the lower trendline instead, $0.6964 is the first level to watch, with $0.6520 as the deeper target if that also fails.
Neither direction is favored by the pattern itself; what matters is which trendline actually breaks first and whether the breakout candle closes beyond it rather than just wicking through.
| 1D Level | Price | Importance |
|---|---|---|
| Resistance 2 | $0.9088 | Extended bullish target |
| Resistance 1 | $0.8284 | Triangle breakout target |
| Support 1 | $0.6964 | The first level of the triangle breaks down |
| Support 2 | $0.6520 | Deeper breakdown target |
SUI Price Scenarios: Bullish, Neutral, Bearish
Daily Chart (Symmetrical Triangle)
| Scenario | Trigger | Price Targets |
|---|---|---|
| Bullish Breakout | Daily close above $0.8284 | $0.8284 $0.9088 |
| Neutral / Range-Bound | Price stays inside the triangle near the apex | Continued tight chop |
| Bearish Breakdown | Daily close below $0.6964 | $0.6964 $0.6520 |
4-Hour Chart (Rising Channel)
| Scenario | Trigger | Price Targets |
|---|---|---|
| Bullish Breakout | 4H close above $0.7833 | $0.7833 $0.8196 |
| Neutral / Range-Bound | Price stays between $0.7216 and $0.7833 | Continued chop inside the channel |
| Bearish Breakdown | 4H close below $0.7216 | $0.7216 $0.6965 |
How SUI Compares to Other Layer-1s
SUI's object-centric data model and parallel transaction execution set it apart from account-based chains like Solana.
While its Move-based, non-EVM architecture separates it from Ethereum-tooling-first competitors.
None of that changes what the chart is doing this week, but it's useful context for why SUI's price cycles don't always track the rest of the layer-1 sector one-for-one.
Bear Case: What Would Invalidate This Setup
A brief wick above $0.8284 or below $0.6964 doesn't confirm anything on its own; this setup needs a full daily candle close beyond those levels, not just an intraday touch through the triangle's trendlines.
Beyond the usual BTC dominance and ETH correlation risk, two SUI-specific risks are worth flagging:
-
Liquidation-driven wicks: given the two-sided liquidation swings above, sharp moves through either level are possible without representing a genuine trend change.
-
Narrative-driven drag: if Mysten Labs' confidential-transaction push runs into unexpected regulatory scrutiny around privacy features, sentiment could shift faster than the chart adjusts. It's worth monitoring even though it isn't priced into this setup today.
Glossary
Symmetrical triangle: a pattern formed by a falling trendline (connecting lower highs) and a rising trendline (connecting higher lows) converging toward a point, a squeeze that doesn't favor either direction until it breaks.
Rising channel: an uptrend structure bound by two parallel rising lines.
Resistance zone: a price band where selling pressure has previously overwhelmed buyers.
Liquidation: the forced closing of a leveraged position when losses exceed available margin.
Methodology
Price and chart levels in this SUI price prediction are read directly from 1D and 4H Binance charts on TradingView, screenshots dated July 18, 2026.
The daily and 4-hour breakdown levels are anchored to the same swing high and swing low across both timeframes.
Liquidation figures come from a liquidation-tracking dashboard, and futures volume figures come from an exchange volume heatmap, both dated July 18, 2026.
The Mysten Labs comment is sourced from a report published by Crypto Banter and presented as context, not as a price signal.
No level in this piece is extrapolated beyond what these sources show, and all price levels should be reconfirmed against live charts before publishing, since crypto prices can move meaningfully within hours.
Final Outlook: SUI Needs Volume Behind the Breakout
SUI's endgame here is simple to state and hard to predict: the daily symmetrical triangle is compressing right at its apex, and whichever trendline breaks first with a confirmed close is likely to decide the next leg.
The mixed liquidation data over the past 24 hours suggests neither side has full control yet, and Binance's dominant share of futures volume means a genuine breakout will most likely show up there first.
Break above with conviction and $0.8284, then $0.9088, come into range; break down instead and $0.6964, then $0.6520, are the levels to watch.
This triangle breakout is the one trigger that matters over the next few sessions; everything else here is context.
Cryptocurrency markets are highly volatile, and this article is for informational purposes only; it should not be considered financial advice.
Always do your own research before making investment decisions.
















