TAC Protocol Price Prediction: 61% Rally Signals Recovery


Something is shifting for $TAC, and traders can't stop talking about it. After weeks of brutal selling, the chart just flashed a shape bulls have been waiting for.
Is this a real recovery, or one more trap before the next leg down? Here's everything worth knowing before you make a move.
TAC Protocol Price Prediction: What Is Fueling Today's Jump?
TAC Protocol price prediction is the question everyone in the community is asking after this week's wild swing.
Basically, the coin went from being written off by most traders to suddenly showing up on every trending list.
Turns out, this kind of move does not happen without a reason.
Something changed in trader sentiment almost overnight, and volume tells part of that story.
Here's the thing: TAC Protocol has been through a brutal few weeks.
But the way the price reacted at its lowest point looks different from the previous drops.
We noticed something else too. Buyers stepped in right around a zone that had been ignored before.
That rarely happens by accident.
So is this the bottom, or just a pause before more downside?
That question is exactly what this breakdown tries to answer.
TAC Protocol Snapshot: The Key Numbers Today
| Field | Data |
|---|---|
| Coin Name | TAC Protocol |
| Ticker Symbol | TAC |
| Blockchain | BNB Smart Chain (BEP-20) |
| Today High | $0.00521 |
| Today Low | $0.002558 |
| RSI Level | 34.14 |
| Token Type | Utility Token |
| Token Category | Cross-chain Infrastructure |
| Market Cap | $19.83M |
| 24H Trading Volume | $29.5M |
| 24H Trading Volume Change | +43.06% |
| Circulating Supply | 4.68B TAC |
| 24H Change | +61.94% |
Source: Data by CoinMarketCap
What Exactly Is TAC Protocol Coin?
The $TAC is a token built on the BNB Smart Chain, designed around cross-chain infrastructure and connectivity tools.
It launched with a focus on linking separate blockchain ecosystems together, and that's part of why traders still track its Binance mainnet upgrade progress closely.
TAC Protocol All-Time High And Low: A Quick Look Back
TAC hit its all-time high of $0.06688 on June 30, 2026, just over a week ago.
From there it fell more than 93 percent, which shows how sharp this correction really was.
On the other end, its all-time low sits near $0.001286, set back in October last year.
The current price is still well above that floor, and that's worth remembering before assuming the worst.
Why Traders Are Watching $TAC Closely
TAC Protocol carries a CertiK safety rating of 4.3 out of 5, which gives it some credibility beyond pure hype.
And unlike a lot of low-cap tokens, it already has close to four thousand holders and steady exchange activity behind it.
Exchange listings and routing activity, including flow through Binance, keep liquidity active even during the rough weeks.
How Many $TAC Traders Got Liquidated Today?
Liquidations happen when leveraged traders get forced out of a position because the price moved against them.
TAC Protocol saw $737.14K in total liquidations over the past 24 hours, and longs took most of the pain.
| Timeframe | Total Liquidations | Long Liquidations | Short Liquidations |
|---|---|---|---|
| 1 Hour | $2.11K | $1.68K | $432.46 |
| 4 Hours | $308.33K | $170.39K | $137.93K |
| 12 Hours | $691.16K | $279.75K | $411.41K |
| 24 Hours | $737.14K | $309.27K | $427.87K |
Source: Liquidation data by CoinGlass
More longs got wiped out than shorts across every window, which lines up with the sharp red candle on the chart.
Does TAC Protocol Have Real Fundamentals Behind It?
The project sits on BNB Smart Chain with a fully diluted valuation near $43.57M against a market cap of just $19.83M.
That gap matters. It means a large chunk of supply is still to enter circulation, which could pressure prices down the road.
For now, crypto price predictions around $TAC lean on this early-stage setup rather than long-term proof.
TAC Protocol Technical Chart Analysis Flashes A Rounded Bottom Signal
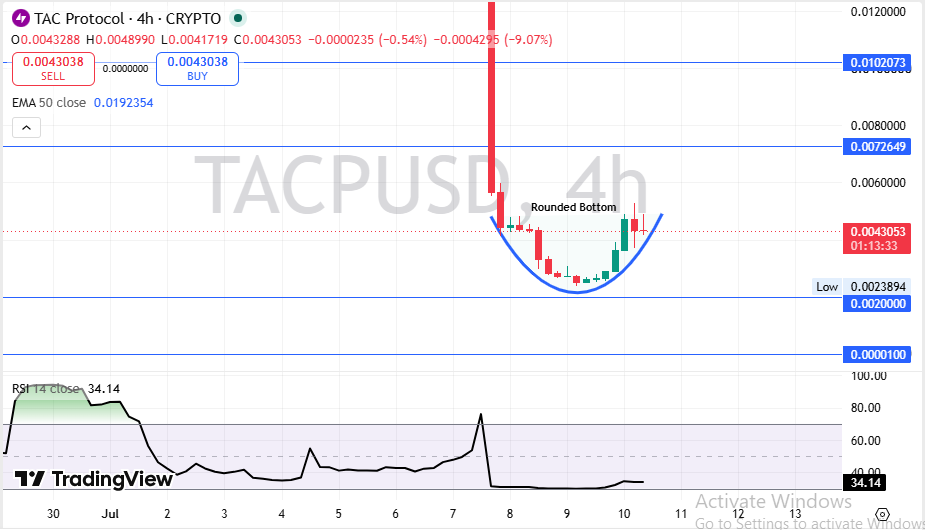
The price crashed hard first. Then it stopped falling.
That pause is what formed the rounded bottom pattern now visible on the 4-hour chart.
Source: Charting by TradingView
RSI sits at 34.14, still on the weaker side but climbing off its lows.
Price remains far below the 50 EMA near $0.0192, so the bigger trend is still down.
But short-term buyers are clearly active. Volume jumped over 43 percent in a single day.
Resistance waits at $0.0072649 and then $0.0102073.
Support holds near $0.0020.
Where Is $TAC Trading Volume Coming From Today?
Most of the action is sitting on one exchange, and that's worth knowing before reading too much into the bounce.
Binance alone carries $145.18M of volume, dwarfing every other venue combined.
| Exchange | 24H Volume |
|---|---|
| Binance | $145.18M |
| Bybit | $29.47M |
| KuCoin | $11.97M |
| Bitget | $11.86M |
| Gate | $8.79M |
| Bitunix | $8.76M |
| MEXC | $5.99M |
| BingX | $4.33M |
Source: Volume heatmap by CoinGlass
That kind of concentration means liquidity could thin out fast if Binance activity slows down.
How TAC Protocol Stacks Up Against Other Small Cap Coins
Compared to tokens like SkyAI, $TAC shows a similar pattern of sharp crashes followed by fast recoveries.
Both coins share high volume to market cap ratios, which usually means more volatility ahead, not less.
Meanwhile bigger names like Bitcoin and Ethereum tend to move slower, which is why small caps like $TAC pull in short-term traders.
TAC Protocol Price Prediction For The Next Few Weeks
The short-term picture depends on whether buyers can hold recent gains without giving them all back.
| Timeframe | Bearish Target | Base Target | Bullish Target | Key Trigger |
|---|---|---|---|---|
| 24 Hours | $0.0038 | $0.0043 | $0.0049 | Volume follow-through after today's surge |
| 3-7 Days | $0.0030 | $0.0045 | $0.0060 | Price holds support without a new low |
| 2-4 Weeks | $0.0025 | $0.0055 | $0.0073 | Close above first resistance on strong volume |
Watch the reaction near $0.0073; that's the level that decides the next few weeks.
TAC Protocol Long-Term Price Outlook And Predictions
The bigger picture still depends on adoption catching up to the current valuation.
| Timeframe | Bearish Target | Base Target | Bullish Target | Catalyst Needed |
|---|---|---|---|---|
| 3 Months | $0.0018 | $0.0060 | $0.0102 | Sustained exchange volume and new listings |
| 6 Months | $0.0015 | $0.0080 | $0.0150 | Real cross-chain usage data |
| End of Year | $0.0012 | $0.0095 | $0.0200 | Broader altcoin market trends turning positive |
| 2027 Outlook | $0.0010 | $0.0120 | $0.0300 | Meaningful partnerships beyond speculation |
The long-term case is not proven yet, and that's worth being honest about.
Three Ways $TAC Price Could Move From Here
Worst Case: Selling resumes and price slips back below $0.0020, breaking the rounded bottom structure entirely. That would likely happen if broader crypto sentiment turns sharply negative again.
Base Case: Price chops between $0.0030 and $0.0060 for a while as the market decides direction. This is the most realistic path given current volume and holder behavior.
Best Case: $TAC clears $0.0073 with strong volume and pushes toward $0.0102. That needs a real catalyst, not just short covering, to hold.
| Scenario | Price Range | What Triggers It |
|---|---|---|
| Worst Case | Below $0.0020 | Structure breakdown and renewed selling pressure. |
| Base Case | $0.0030 - $0.0060 | Sideways consolidation with no major catalyst. |
| Best Case | Above $0.0073 | Volume-driven breakout above key resistance. |
Key TAC Protocol Support And Resistance Levels To Watch
Resistance zone: $0.0072649, and then $0.0102073 above that. A close above the first level on strong volume opens the door to higher levels.
Support zone: $0.0020 is the level buyers have defended so far during this bounce.
Invalidation zone: A daily close back near the recent lows would invalidate the rounded bottom setup completely.
Analyst View And Final Thoughts On $TAC Price
When we pulled up the RSI, the first thing that stood out was how far price had fallen before finally catching a bid.
The rounded bottom pattern is real, but it sits well below the 50 EMA, and that's a trend problem the coin has not solved yet.
A weekly close above $0.0072649 would be the clearest signal that buyers are serious, not just reacting to a bounce.
One thing worth tracking outside the chart is broader market mood. Checking something like the fear and greed index can add useful context here.
The most important level right now is $0.0020. Lose that, and this recovery story falls apart fast.
Hold it, and $TAC might just be building the base for its next real move.
Disclaimer: This article is for educational purposes only and does not constitute financial advice. Crypto markets are volatile. Consult your investment advisor before making any investment decision.
1 month ago
FROM CRAB FISHERMAN TO $64 MILLION LOTTO WINNER WITH LORD BUBUZA SPELL: I have been a crab fisherman for 40 years. I started working at a local fish plant a few years ago. I love playing lotto bets, so I buy lotto tickets often but find it difficult to win. I read about Lord Bubuza's lottery spells on the internet, so I contacted him for help to win Lotto 649. He told me that he would need to cast a lotto spell so that he can reveal the lotto numbers I will choose. I was sceptical, but my wife Nancy told me to give it a try. I provided his requirements to cast the lotto spells, and he gave me the numbers. I bought a Lotto 649 ticket and played as Lord Bubuza instructed, to my surprise it was a big win. I won $64,000,000. My partner Nancy and I travelled to the Atlantic Lottery in Moncton to confirm the win and collect the prize. I will retire from my crab fishing with this win and continue to recommend lord Bubuza. Join me and appreciate Lord Bubuza for his help via Email: lordbubuzamiraclework@hotmail.com or WhatsApp: +1 (365) 808 5313

1 month ago
FROM CRAB FISHERMAN TO $64 MILLION LOTTO WINNER WITH LORD BUBUZA SPELL: I have been a crab fisherman for 40 years. I started working at a local fish plant a few years ago. I love playing lotto bets, so I buy lotto tickets often but find it difficult to win. I read about Lord Bubuza's lottery spells on the internet, so I contacted him for help to win Lotto 649. He told me that he would need to cast a lotto spell so that he can reveal the lotto numbers I will choose. I was sceptical, but my wife Nancy told me to give it a try. I provided his requirements to cast the lotto spells, and he gave me the numbers. I bought a Lotto 649 ticket and played as Lord Bubuza instructed, to my surprise it was a big win. I won $64,000,000. My partner Nancy and I travelled to the Atlantic Lottery in Moncton to confirm the win and collect the prize. I will retire from my crab fishing with this win and continue to recommend lord Bubuza. Join me and appreciate Lord Bubuza for his help via Email: lordbubuzamiraclework@hotmail.com or WhatsApp: +1 (365) 808 5313
2 months ago
Hello everyone, greetings from Miss Shanghai Carlo, i was a victim of online scam, got registered on a trading website which turns out to be scam, they call their brand FX pro trader, i work for a popular organization and i handle the payroll, after losing all my funds to scammer, they hacked into my Email and divert all payment to unknown account which were only able to decode by Alien Wizbot hack service tools, during the recovering process the scammers phone were hacked in other to get them arrested, don't just recover your funds but also get them arrested, this differentiate the real hacker from impersonator's. today i am happy to write here and to inform you all that I regained my work position and all funds recovered, lastly, the thieves are serving in prison now, God bless America. reach alienwizbot(@)gmail(.)com for help or Whatsapp +16262645164
2 months ago
I just have to introduce this hacker that I have been working with him on getting my credit score been boosted across the Equifax, TransUnion and Experian report. He made a lot of good changes on my credit report by erasing all the past eviction, bad collections and DUI off my credit report history and also increased my FICO score above 876 across my three credit bureaus report you can contatc him for all kind of hacks, he helped my sister get all her stolen funds from a fraudulent cryptocurrency company . Email him here via EMAIL realcyberhackers @ gmail com orwhatsapp +14106350697
2 months ago
After being scammed out of $124,000 by an individual I met online through a fraudulent investment scheme, I sought legal assistance to recover my funds that i lost in crypto Thank God for my husband who told me about DAREK RECOVERY I contacted them on recoverydarek@ gmail. com and in less than 48 hours all my funds where recovered The company are very real and reliable in recovery funds back from scammers.
2 months ago
After being scammed out of $124,000 by an individual I met online through a fraudulent investment scheme, I sought legal assistance to recover my funds that i lost in crypto Thank God for my husband who told me about DAREK RECOVERY I contacted them on recoverydarek@ gmail. com and in less than 48 hours all my funds where recovered The company are very real and reliable in recovery funds back from scammers.

















