Talus Price Prediction: Can US Hold the Short Squeeze Rally?


Talus just did something most small caps only dream about. It went from a coin nobody was watching to one of the loudest movers on the board, and it did it in a matter of weeks. The question now isn't whether $US had a good run. It's whether that run has any legs left or whether the chart is quietly setting up for a reset. Here's what the data actually says.
Talus Price Prediction Today: What's Driving the Move
This Talus price prediction starts with a chart that's broken above its own rising channel, not a small move for a coin trading under five cents. The move is being fueled by a jump in trading volume and a wave of short positions getting forced out of the market.
Buyers pushed straight through resistance that had held for days. It's the kind of sharp, squeeze-driven move that raises the same "how much further" question every time. But a move this fast tends to invite its own correction. That tension between momentum and overextension is what this Talus price prediction has to work through.
Key Takeaways
-
Direction: Bullish, but stretched short-term
-
Why: Breakout above the ascending channel plus a heavy short squeeze
-
Short-term range: $0.038 to $0.049
-
Invalidation level: A close below $0.0205 flips the setup bearish
Talus Coin Overview
| Metric | Value |
|---|---|
| Coin Name | Talus Network |
| Ticker | US |
| Blockchain | Sui |
| Today's High | $0.04531 |
| Today's Low | $0.04151 |
| RSI Level (14, 4H) | 90.1 |
| Token Type | Utility |
| Token Category | Layer-1 Ecosystem Token |
| Market Cap | $98.22M |
| 24H Volume | $23.1M |
| 24H Volume Change | +187.94% |
| Circulating Supply | 2.2B US |
| Max Supply | 10B US |
| 24H Change | +36.6% |
Data as of Jul 16, 2026. Price and market cap figures as per CoinMarketCap, with supporting snapshot data from DexScreener where noted.
$US Network Background
Talus runs on the Sui blockchain and positions itself as an agent-focused infrastructure project. It's young: the all-time low on record was set in March 2026, just over four months ago.
$US Price History and Performance
Talus has moved almost entirely in one direction since its March low of $0.002678, hit on Mar 8, 2026. As per CoinMarketCap, it printed a fresh all-time high of $0.04514 within the last hour of this writing, a gain of more than 1,500% off that bottom, with the last 24 hours alone adding 36.6%. That's a coin repriced almost overnight.
Why Talus Is Getting Attention Right Now
Turns out, most of this move traces back to positioning, not fresh fundamentals. Short sellers piled in expecting a pullback, and when the breakout hit, they were forced to cover, adding fuel on top of strong spot buying.
where large positioning shifts moved price faster than fundamentals alone could explain. Trading is heavily concentrated on Binance, which handled over $183M in recent futures volume, with Bybit and Bitget making up most of the rest. That concentration means big moves on one venue can drag the whole market with them.
$US Liquidation Data
Liquidations tell the real story. Over the past 24 hours, roughly $1.15M in positions were wiped out, and $1.06M of that came from short traders, as per CoinGlass. The 12-hour window looked similar, with shorts losing nearly $877K against just $53K on the long side. This was a squeeze, and squeezes tend to run out of fuel once the trapped shorts are gone.
Talus Fundamental Analysis
Circulating supply sits at 2.2B out of a 10B max supply, just 22% of the total. The unlocked market cap already reads $136.39M against a live market cap of $98.22M, and the fully diluted valuation runs close to $446M. That gap between what's circulating and what's still to come can cap upside once early holders start unlocking. CertiK rates the project 3.8 out of 5, a middling score.
Talus Technical Price Analysis
The price is trading well above its own trend. The 50 EMA sits at $0.026252 on the 4-hour chart, far below the current $0.044807, a sign this move has outrun its own average. RSI is at 90.1, deep into overbought territory, and stretches like this rarely hold for long without a pause or pullback.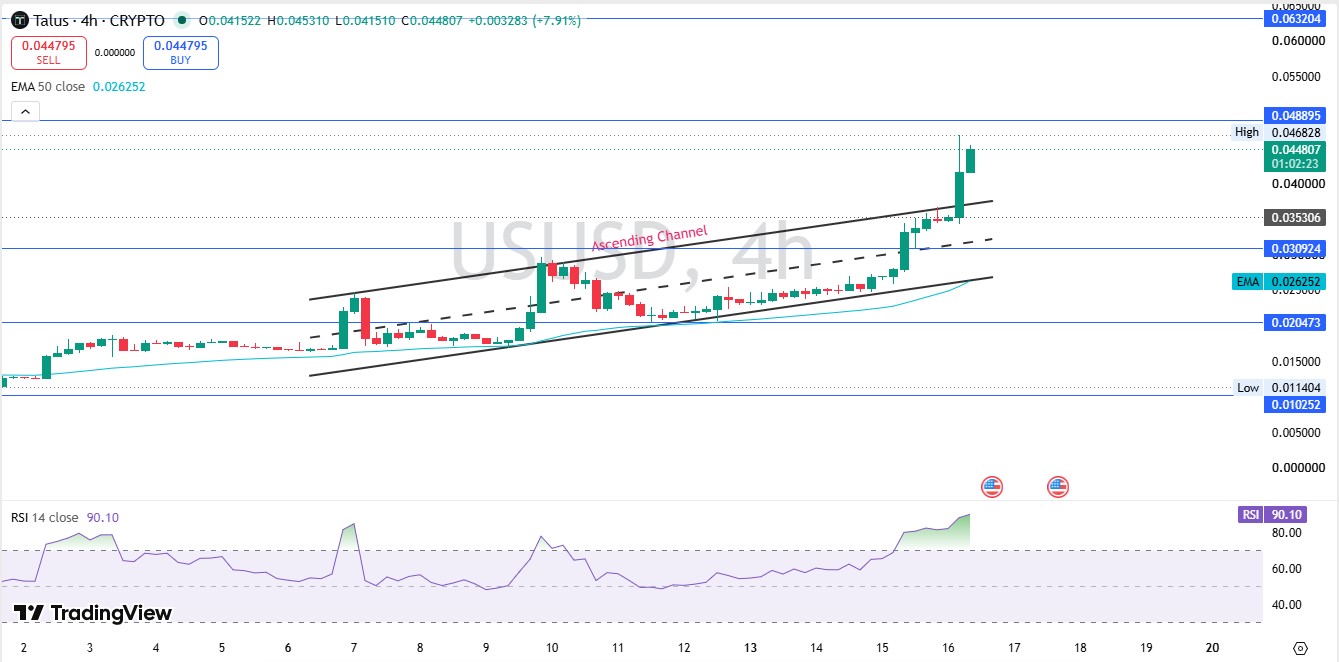
Source: Charting by TradingView
Support sits at $0.030924, the last real floor before the ascending channel gives way. Lose that, and the bullish structure weakens fast.
Resistance is stacked at $0.048895 first, then $0.063204, as per TradingView. A clean close above the first level on strong volume opens the door toward the second. Fail there instead, and a cooldown back toward the EMA wouldn't be surprising.
Right now, this is the level that decides the next move: hold $0.030924, and the trend stays intact. Lose it, and the picture shifts quickly.
$US Volume Heatmap
Futures activity is dominated by Binance at $183.56M, with Bybit at $46.62M and Bitget at $32.58M behind it, as per CoinGlass. Smaller venues like Gate, MEXC, Bitunix, LBank, and BingX handle single-digit millions each once you look past the top three.
$US vs Other Small-Cap Sui Tokens
Here's the thing: a 0.96% liquidity-to-market-cap ratio, per DexScreener, is thin even by small-cap standards, where 2 to 3% is typical for coins that have run this hard.
Talus Short-Term Price Prediction
The next few weeks likely hinge on whether $0.030924 holds as support and whether resistance near $0.049 gets tested again.
| Timeframe | Bearish | Base | Bullish | Key Trigger |
|---|---|---|---|---|
| 24 Hours | $0.038 | $0.044 | $0.049 | Reaction at first resistance |
| 3-7 Days | $0.032 | $0.041 | $0.052 | RSI cooling from overbought |
| 2-4 Weeks | $0.026 | $0.037 | $0.060 | Support and channel base holding |
These ranges come from current support and resistance zones plus how RSI has reacted at similarly stretched levels before. Watch $0.030924 closely. Lose it, and the short-term picture changes fast.
Talus Long-Term Price Prediction
| Period | Bearish | Base | Bullish | Catalyst Needed |
|---|---|---|---|---|
| 3 Months | $0.018 | $0.035 | $0.065 | Continued exchange volume growth |
| 6 Months | $0.015 | $0.040 | $0.075 | New unlock schedule absorbed without dumping |
| End of 2026 | $0.012 | $0.045 | $0.095 | Sustained ecosystem activity on Sui |
| 2027 Outlook | $0.010 | $0.050 | $0.120 | Token utility expansion beyond speculation |
Longer term, this is still a young token riding a short squeeze more than proven demand. The bullish case needs real usage to show up, not just volume spikes.
Talus Three Price Scenarios
Worst Case: Price loses $0.030924 support and slides toward the EMA. Triggered by profit-taking or a weak follow-through on resistance.
Base Case: Price consolidates between $0.035 and $0.049 as the market digests the squeeze. Triggered by RSI cooling without a major sell-off.
Best Case: Price clears $0.048895 on strong volume and pushes toward $0.063204. Triggered by continued short covering plus fresh spot demand.
| Scenario | Price Range | What Triggers It |
|---|---|---|
| Worst Case | $0.018 - $0.028 | Support breaks; longs get squeezed instead |
| Base Case | $0.035 - $0.049 | Sideways digestion, RSI resets |
| Best Case | $0.049 - $0.063+ | Resistance clears on strong volume |
Talus Key Price Levels to Watch
Resistance Zone: $0.048895 first, then $0.063204. Both need a volume-backed close to matter, not just a wick.
Support Zone: $0.030924, the last line before the ascending structure breaks down.
Invalidation Zone: $0.020473. A close below this would undo the bullish setup built since March.
Talus Risk Factors
Liquidity risk: with liquidity near $535K against a market cap over $98M, larger orders can swing price hard either way.
Volatility risk: a small-cap token that already moved over 1,500% off its low. Sharp reversals are common in coins with this profile, and broader risk appetite tracked by tools like the Fear and Greed Index can amplify moves like this in either direction.
Thesis breakers: a close below $0.020473; a large token unlock, given only 22% of the supply is circulating; or a broader market pullback dragging small caps down—something worth watching alongside the wider Bitcoin price forecast for July, since small caps tend to follow BTC's lead when sentiment turns.
Talus Network Analyst View and Final Thoughts
The chart setup is genuinely bullish right now. But it's bullish in the way a coin looks right after a squeeze, not the way it looks when demand is organic and steady.
RSI at 90.1 doesn't hold for long. It resolves through a pause that lets the average catch up, or a sharper pullback that resets the picture.
A weekly close above $0.048895 would be the strongest signal here, suggesting buyers are willing to defend new highs, not just chase a squeeze.
One external factor worth tracking is broader Sui ecosystem activity. A slowdown there would likely show up in Talus first, given how thin its liquidity is.
The most important level on this chart is $0.030924. Hold that on a closing basis, and the bullish structure stays intact.
And if it doesn't hold, this Talus price prediction shifts from "breakout" to "blow-off top" fast. For now, the trend is up. But it needs the tape to keep proving it, not just the last 24 hours.
Talus Key Takeaways
-
Talus (US) broke out of its ascending channel with RSI at an extreme 90.1
-
The rally was heavily fueled by a short squeeze, with $1.06M in shorts liquidated in 24 hours
-
Support at $0.030924 is the level to watch; losing it weakens the entire setup
-
Only 22% of total supply is circulating, which is a real dilution risk longer term
-
Liquidity is thin relative to market cap, so price swings can be sharp in both directions
Disclaimer:
This article is for educational purposes only and does not constitute financial advice. Crypto markets are volatile. Consult your investment advisor before making any investment decision.
Also read:
















