TENDIES Price Prediction: Can This Meme Coin Keep Climbing?


TENDIES price prediction is suddenly the question every meme coin trader on the Robinhood ecosystem wants answered right now. A coin that barely existed a week ago has turned into one of the loudest names among crypto price predictions circulating on Twitter overnight, and the chart is doing something that is hard to ignore.
A Tiny Meme Coin Just Turned Heads Across Crypto Twitter
Something strange happened this week on the Robinhood chain. $TENDIES price prediction chatter has exploded, and it's not the usual quiet meme coin talk either.
Traders are not just watching a number go up. They're watching a coin barely six days old post-triple-digit swings that would make even Bitcoin bulls uncomfortable.
Turns out, that kind of move rarely happens without a reason. And here, the reason is a mix of thin liquidity, fresh listing hype, and a wave of momentum buyers chasing green candles.
Basically, TENDIES did in a week what most tokens take months to attempt: it built a following, ran to a new high, then gave some of it back just as fast.
That raises a bigger question: one the market has not fully answered yet. Is this the start of something bigger, or just another meme coin burning bright before it fades?
KEY TAKEAWAYS
-
Direction: Short-term structure still leans bullish inside an ascending channel
-
Reason: Fresh listing hype plus rising Robinhood ecosystem attention
-
Short-term range: Roughly $0.018 to $0.035
-
Invalidation: A close below $0.01285 weakens the setup
Everything You Need to Know About the TENDIES Token Right Now
| Field | Detail |
|---|---|
| Coin Name | TENDIES |
| Ticker Symbol | TENDIES |
| Blockchain | Robinhood Chain (Uniswap V3) |
| Today High | $0.02542 |
| Today Low | $0.02041 |
| RSI Level | 58.52 |
| Token Type | Meme Coin |
| Token Category | Meme, Robinhood Ecosystem |
| Market Cap | $20.656M |
| 24H Trading Volume | $9.691M |
| Contract Address | 0x45242320dbb855eea8fd36804c6487e10e97fcf9 |
| Circulating Supply | 1B TENDIES |
| 24H Change | +36.0% |
Source: Data by CoinGecko
What Exactly Is TENDIES and Why Is Everyone Talking About Them?
TENDIES is a meme coin built inside the Robinhood ecosystem, changing hands through a Uniswap trading pool rather than a centralized order book. It launched only days ago, and people care mainly because of how fast it moved from a fraction of a cent to a multi-cent token.
There's no complicated tech story here. It's attention, liquidity, and timing, the same three things that decide most top memecoins in their first weeks.
Where $TENDIES Has Been Since It First Started Trading
The numbers tell a wild story. $TENDIES hit an all-time low of $0.002205 on July 12, then an all-time high of $0.03374 just one day before this article, according to CoinGecko.
That's an 837% run off the bottom. But here's the thing: it's already down close to 39% from that peak, which shows just how thin and reactive this market still is.
Why This Coin Matters Beyond the Hype Cycle Right Now
We pulled up the volume data, and the first thing that stood out was how much cash is moving through a coin this young. Some of that early rush looks similar to how recent crypto airdrops pull in fast attention, with a $9.691 million 24-hour volume against a $20.656 million market cap that is not a small number.
And that ratio matters. It tells us real trading interest exists here, not just a handful of wallets pushing price around inside the Robinhood ecosystem's trading base.
Supply, Demand, and the Fundamentals Behind the Chart
TENDIES has a fixed 1 billion token supply, fully circulating already. As per CoinGecko, there is no locked or vesting supply waiting to hit the market, which removes one common source of future sell pressure.
That said, meme coins run on sentiment more than fundamentals. Without fresh listings on larger crypto exchanges or continued attention, even a clean supply structure will not hold price up on its own, and that's a risk worth taking seriously.
Technical Analysis: TENDIES Breaks Higher Inside a Tightening Ascending Channel
Price is trading inside a rising channel on the 1-hour chart, a structure visible in GeckoTerminal chart data that started forming around July 15 and has held since. According to GeckoTerminal, that's the main technical story right now, before any indicator gets involved.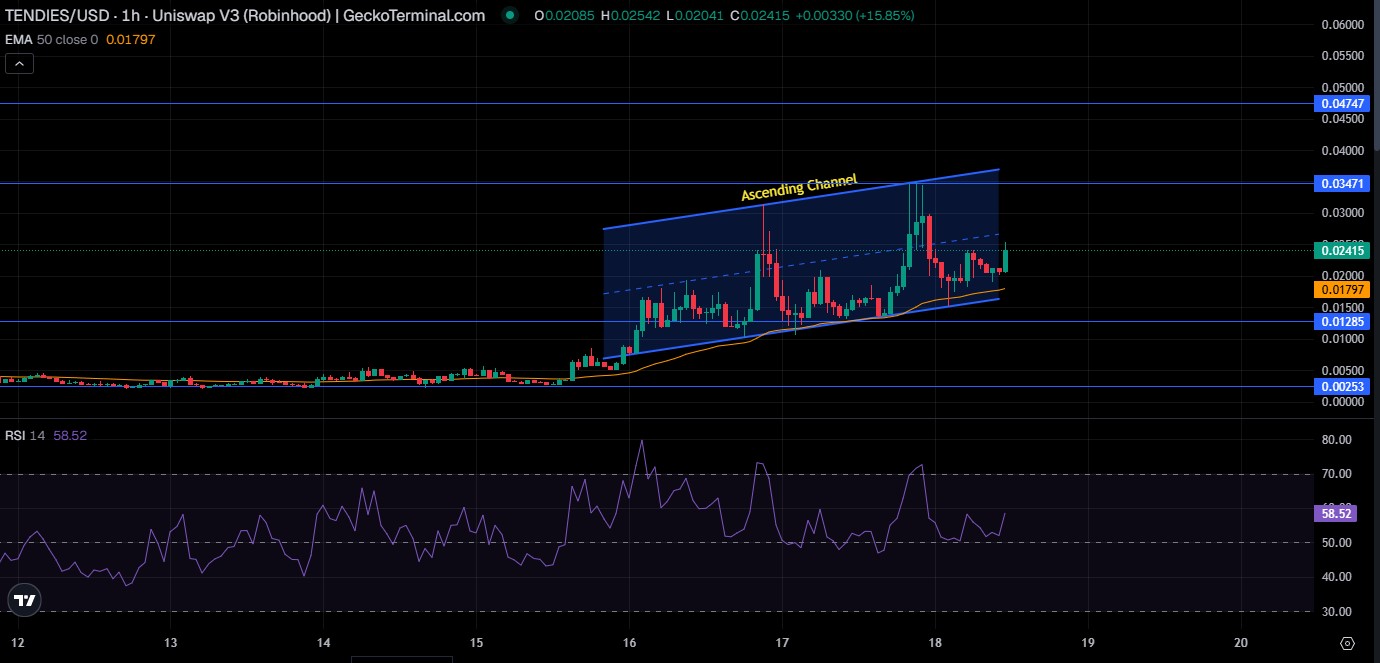
Source: Charts by GeckoTerminal
Price sits above the 50 EMA at $0.01797, a sign buyers are still in control of the short-term trend. RSI reads 58.52, comfortably neutral to bullish, with room left before hitting overbought territory near 70.
Immediate resistance sits at $0.03471, with a bigger wall at $0.04747 above that. On the downside, $0.01285 is the level bulls need to defend; a clean break below it would flip the short-term structure bearish and open a path toward the invalidation zone near $0.00253.
How TENDIES Stacks Up Against Other Fresh Meme Coin Launches
Compared with typical altcoin market launches, TENDIES is showing above-average volume relative to its market cap. Most new meme tokens see volume fade fast after the first 48 hours; this one has not, at least not yet.
That does not guarantee it holds up. But it does put TENDIES ahead of most tokens sitting in the crypto presale to early-trading pipeline in terms of raw activity.
What Short-Term Traders Should Expect From TENDIES This Week
The next few days likely hinge on whether price can hold the channel's lower boundary near $0.018 to $0.020. Traders tracking fresh listings often check a coin events calendar to catch these moves early, and a bounce from current levels keeps the bullish case alive.
| Timeframe | Bearish Level | Bearish Target | Pivot / Base Level | Base Target | Bullish Level | Bullish Target | Invalidation |
|---|---|---|---|---|---|---|---|
| 24 Hours | 50 EMA | $0.01797 | Today's Low | $0.02041 | Today's High | $0.02542 | Break below $0.01285 |
| 3–7 Days | Key Support | $0.01285 | Channel Mid | $0.02415 | Key Resistance | $0.03471 | Weekly close below $0.01285 |
| 2–4 Weeks | Major Support | $0.00253 | Key Resistance | $0.03471 | Major Resistance | $0.04747 | Weekly close below Major Support |
Source: GeckoTerminal (1H/4H) | Traditional Pivot Points | EMA 50 | Market Structure
Watch $0.01285 closely. It's the line between continuation and a much deeper pullback.
Long-Term TENDIES Forecast: How Realistic Are Higher Targets
Long-term numbers on a six-day-old meme coin come with a warning label attached. Much of the outcome still depends on broader risk appetite, including where Bitcoin price trends over the coming months, since meme coins rarely rally alone in a falling market.
| Timeframe | Bearish Level | Bearish Target | Base Level | Base Target | Bullish Level | Bullish Target | Catalyst Needed |
|---|---|---|---|---|---|---|---|
| 3 Months | Range Low | $0.005 | Key Pivot | $0.020 | Key Resistance | $0.045 | Sustained volume and new exchange listings |
| 6 Months | Macro Support | $0.003 | Mid Range | $0.030 | Major Resistance | $0.070 | Continued Robinhood ecosystem growth |
| End of Year | Macro Support | $0.002 | Key Resistance | $0.050 | Breakout Zone | $0.10 | Strong meme cycle plus rising adoption |
| 2027 Outlook | Macro Support | $0.001 | Major Resistance | $0.06 | New ATH Extension | $0.15 | Broader crypto bull market and lasting community |
Source: GeckoTerminal (Weekly) | Traditional Pivot Points | Macro Trend Analysis
Honestly, the long-term case is weak until TENDIES proves it can survive past the first hype wave. Most meme coins do not.
Three Ways This TENDIES Setup Could Realistically Play Out
Worst Case: Volume dries up and early holders exit. Price loses $0.01285 and drifts back toward the $0.003 to $0.005 zone.
Base Case: Price consolidates between $0.015 and $0.035 for a few weeks. Sentiment stays mixed while the market decides if TENDIES has staying power.
Best Case: New listings, spillover liquidity from the wider Ethereum ecosystem, and continued Robinhood chain attention push volume higher again. Price breaks $0.03471 and retests the recent high near $0.04747.
| Scenario | Price Range | What Triggers It |
|---|---|---|
| Worst Case | $0.003 – $0.01285 | Volume collapse, early holder exit |
| Base Case | $0.015 – $0.035 | Sideways consolidation, mixed sentiment |
| Best Case | $0.035 – $0.05 | Renewed hype, fresh listings, volume spike |
Price Levels Every TENDIES Holder Should Be Watching Closely
Resistance zone: $0.03471 to $0.04747, the area sellers have defended near the recent all-time high.
Support zone: $0.01285, the base of the current ascending channel and the level bulls need to hold.
Invalidation zone: below $0.00253, a level that would confirm the bullish structure has fully broken down.
Analyst View and Final Thoughts on the TENDIES Price Setup
When we pulled up the chart, the ascending channel was the first thing that jumped out. It's been intact since mid-July, and the price is still respecting it.
RSI at 58.52 leaves room to run before hitting overbought conditions. That's a healthy sign, not an exhausted one.
A weekly close above $0.02 would signal buyers are absorbing supply well after the recent pullback from all-time highs. That is the level to watch above everything else.
One factor to track beyond the chart: overall crypto news flow and whether meme coin appetite across the market stays strong or fades into next week.
The setup looks more bullish than most casual observers are giving it credit for, but this remains a young, thin, and volatile token. Treat every level here as a guide, not a guarantee.
Watch $0.01285. Everything else follows from there.
Risk Factors That Could Break the TENDIES Bullish Thesis
-
Liquidity risk: thin order books on a young token mean sharp slippage during fast moves.
-
Volatility risk: 800%+ swings within a week show this market can turn violently in either direction.
-
Thesis breaker: a sustained drop in volume below current levels would remove the main support behind this rally.
Disclaimer
This article is for educational purposes only and does not constitute financial advice. Crypto markets are volatile. Consult your investment advisor before making any investment decision.
Also read:
















