Official Trump Price Prediction: Will $TRUMP Bulls Win This Time?


TRUMP just put in one of its sharper moves in a while, and this official Trump price prediction looks at whether that's the start of something or just a bounce inside a longer slide.
Here's what the daily and 4-hour charts, liquidation data, holder concentration, and exchange volume show right now, and what would actually confirm this move.
Where TRUMP Sits Right Now
TRUMP is sitting around $1.65 as of July 18, 2026. Market cap works out to $1,654,998,480.62 against a circulating supply of roughly 999,999,082 tokens.
On the 24-hour move, the numbers don't quite agree with each other; market-overview data has it at +7.82%. 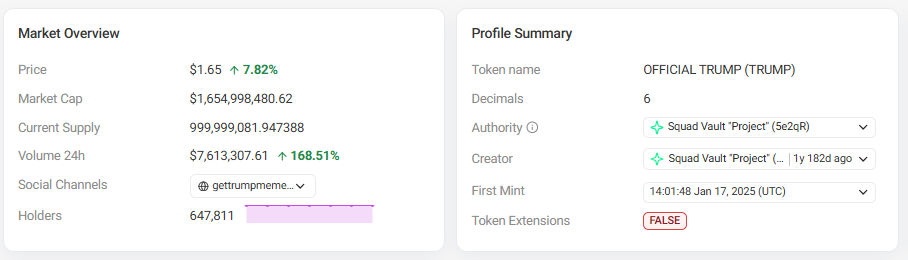
while the daily candle on the OKX chart shows +6.76%. That's just how it goes when you're pulling from two different venues; not a red flag, just something to note.
One number that does stand out: 24-hour trading volume jumped 168.51% to $7,613,307.61, a sign this move came with real participation behind it rather than thin, low-volume drift.
The token currently has 647,811 holders and was first minted on January 17, 2025. Levels below reflect this snapshot; if the price moves meaningfully past either boundary, treat the numbers as due for a refresh.
TRUMP Liquidations: A Mixed, Two-Sided Picture
As per Coinglass liquidation data dashboard reviewed for this piece (data as of July 18, 2026), TRUMP's liquidations have been genuinely two-sided rather than a clean flush in one direction.
Over the last hour, $27.27K was liquidated, with the bulk of it, $24.30K, coming from shorts. Over four hours, the total climbs to $101.15K, split almost evenly between longs ($48.56K) and shorts ($52.59K). 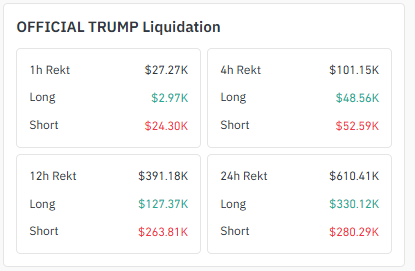
Over 12 hours, shorts take the larger hit at $263.81K against $127.37K from longs, for a total of $391.18K. Over the full 24 hours, the pattern flips slightly, with longs taking the bigger share at $330.12K versus $280.29K from shorts, for a $610.41K total.
Put together, that's a market that's been punishing both sides depending on the window, which fits a sharp trendline bounce like this one.
Shorts got squeezed hard as price snapped up off the trendline, while some of the longs chasing the move have since been shaken out too.
Exchange Volume Heatmap: OKX and Binance Lead
Per the exchange volume heatmap reviewed for this piece (futures volume, data as of July 18, 2026), OKX carries the largest share of TRUMP futures volume at $80.00M.
Binance closes behind at $78.37M together; these two exchanges account for the clear majority of total activity.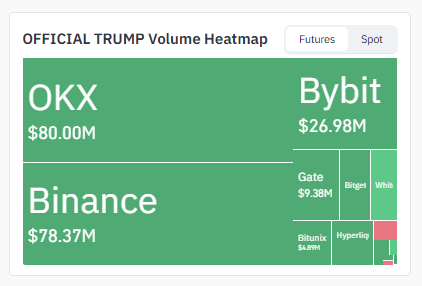
Bybit sits well behind at $26.98M, with Gate ($9.38M) and Bitunix ($4.89M) forming a smaller tier.
Bitget, WhiteBIT, and Hyperliquid round out the remaining volume in smaller amounts. Because OKX and Binance are so close to each other in volume share, a genuine breakout should show up on both, not just one.
TRUMP Whale Concentration: An Extremely Top-Heavy Market
Anyone asking whether TRUMP can sustain a move like this should look closely at who actually holds it.
As per Solscan on-chain holder-analytics dashboard reviewed for this piece, the top 10 wallets alone control 90.25% of the supply, worth roughly $1.49 billion. 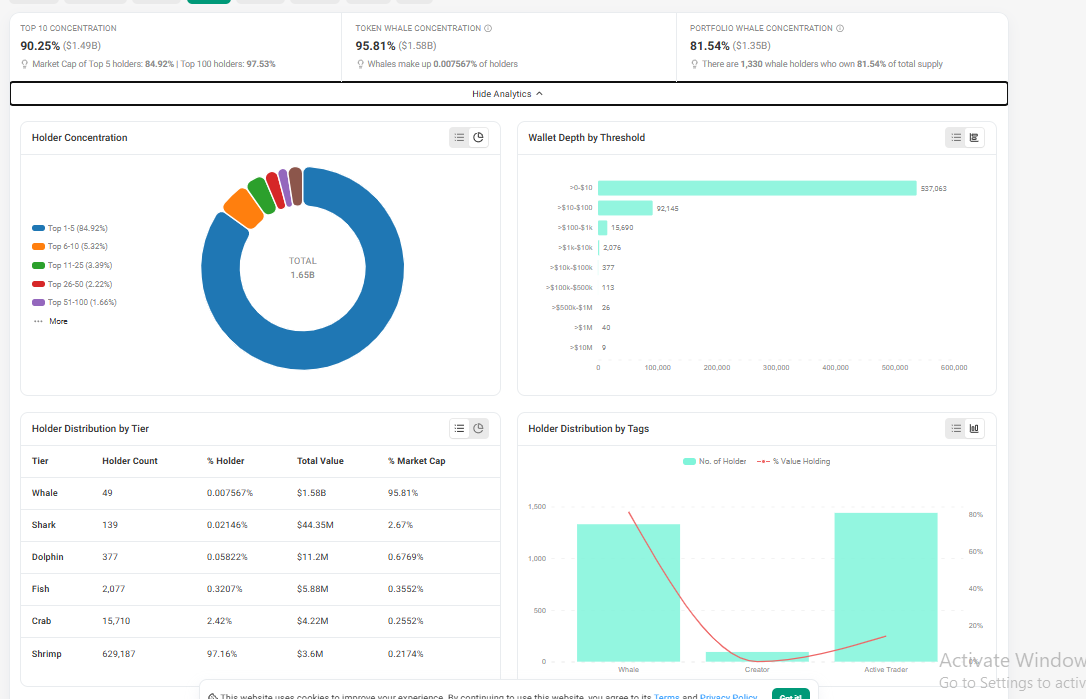
Token-level whale concentration sits at an extreme 95.81%. Whale-tier wallets make up just 0.007567% of all holders but control nearly all the value.
Looking at it by wallet count rather than token contracts, 1,330 whaleholders own 81.54% of the total supply.
Breaking it down by tier: just 49 whale wallets hold 95.81% of market cap, while the shrimp tier 629,187 wallets, or 97.16% of all holders collectively own only 0.2174% of value.
That's a more extreme concentration than most large-cap meme tokens, and it means today's bounce could have been driven, and could just as easily be reversed, by a very small number of wallets.
A breakout confirmed on strong volume across multiple exchanges (see above) carries more weight here than it would for a more evenly distributed token.
Official Trump Forecast: 4H Chart Analysis
The 4-hour chart shows the mechanics of that bounce more clearly.
$TRUMP spent time consolidating in a tight range before pushing up out of it, and the price is now sitting around $1,640, just above that former base. 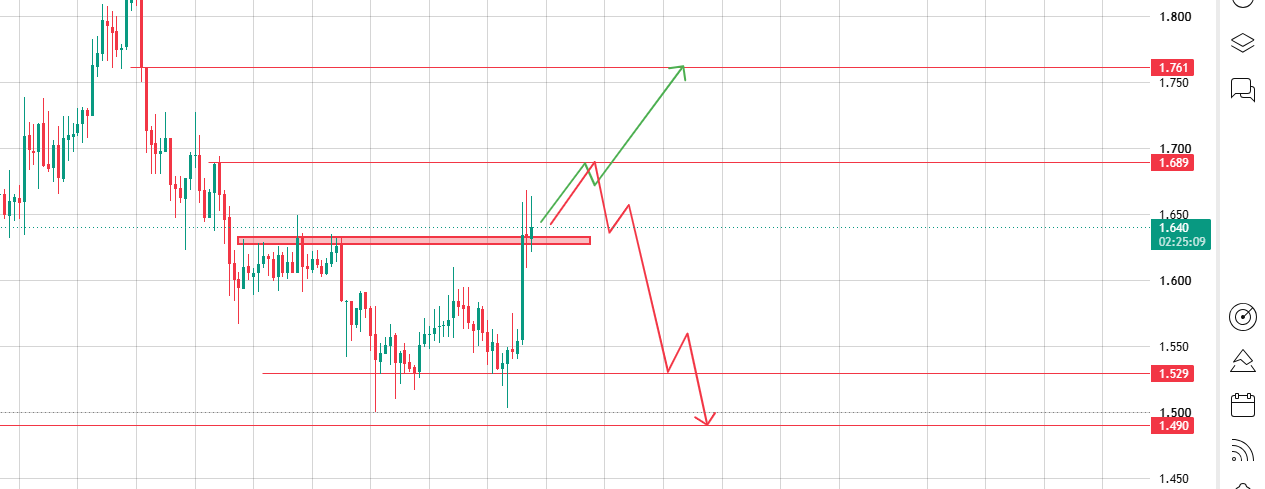
The immediate resistance is $1.689, with $1.761 as the next target if that clears.
On the downside, $1.529 is the first level to watch, with $1.490 close to the top of the old consolidation range as the deeper support if this breakout gives back its gains.
| 4H Level | Price | Importance |
|---|---|---|
| Resistance 2 | $1.761 | Extended target above the breakout |
| Resistance 1 | $1.689 | Immediate resistance |
| Support 1 | $1.529 | Immediate support |
| Support 2 | $1.490 | Former consolidation zone, deeper support |
Official Trump Price Prediction: Daily Chart Bouncing Off the Trendline
On the Daily Chart, TRUMP spent weeks sliding under a falling trendline, and it just bounced sharply right off that same line.
That's the key detail here: this isn't a random green candle; it's a reaction at a specific, previously respected level, which carries more weight than a bounce that happens in open space.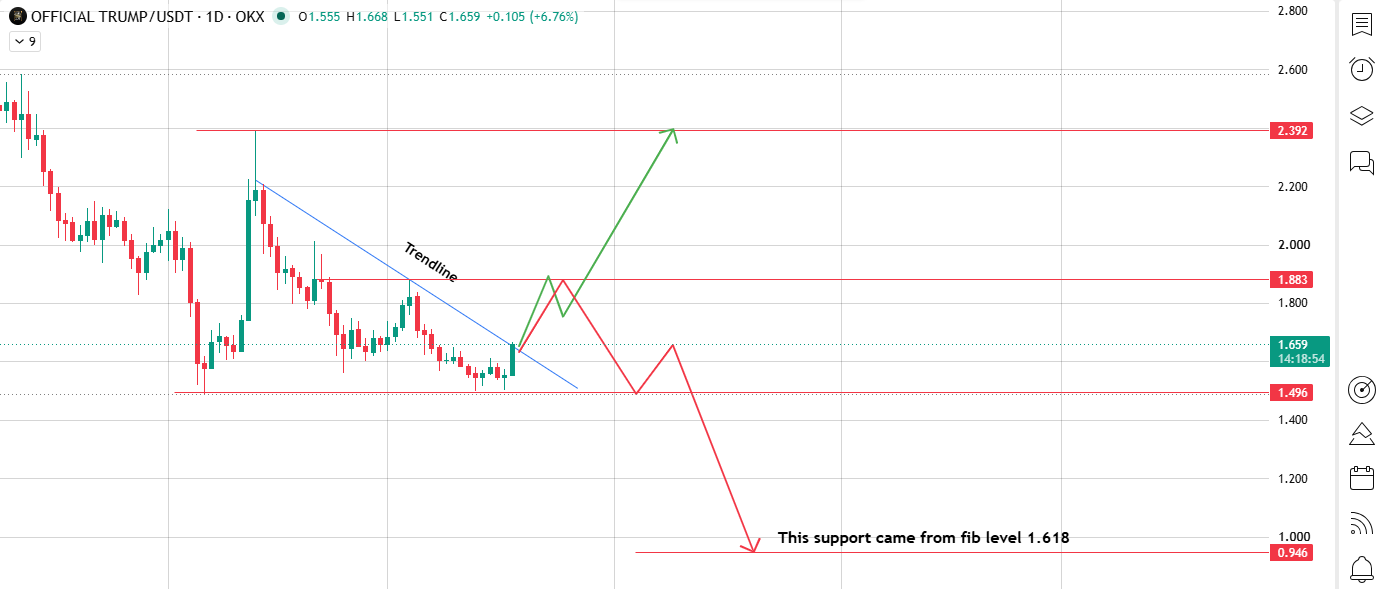
If TRUMP holds above the trendline and pushes on from here, the first target is $1.883.
Clear that with continued momentum, and $2.392 comes into range, a substantial move from current levels.
If the bounce fails and the price drops back below the trendline, $1.496 is the first support to watch, with $0.946 as a deeper target pulled from the 1.618 Fibonacci extension.
| 1D Level | Price | Importance |
|---|---|---|
| Resistance 2 | $2.392 | Extended bullish target |
| Resistance 1 | $1.883 | Key target if the bounce holds |
| Support 1 | $1.496 | Immediate support if the bounce fails |
| Support 2 | $0.946 | 1.618 Fib extension, deeper bearish target |
TRUMP Price Scenarios: Bullish, Neutral, Bearish
Daily Chart (Trendline Bounce)
| Scenario | Trigger | Price Targets |
|---|---|---|
| Bullish Breakout | Daily close holds above the trendline | $1.883 $2.392 |
| Neutral / Range-Bound | Price holds near the trendline without further follow-through | Continued chop |
| Bearish Breakdown | Daily close back below the trendline / loses $1.496 | $1.496 $0.946 |
4-Hour Chart (Fresh Breakout)
| Scenario | Trigger | Price Targets |
|---|---|---|
| Bullish Breakout | 4H close above $1.689 | $1.689 $1.761 |
| Neutral / Range-Bound | Price holds between $1.529 and $1.689 | Continued chop |
| Bearish Breakdown | 4H close below $1.529 | $1.529 $1.490 |
Bear Case: What Would Invalidate This Setup
A brief wick above or below any of these levels doesn't confirm anything on its own; this setup needs a full daily or 4H candle close beyond the trendline and the levels above, not just an intraday touch.
Beyond the usual BTC dominance and ETH correlation risk, two things are worth flagging specifically for TRUMP:
-
Whale-driven reversals: given how few wallets control this token's value, a handful of large holders taking profit into this bounce could erase the move quickly, regardless of what the chart pattern suggests.
-
Two-sided liquidation risk: since both longs and shorts have already been squeezed at different points over the past 24 hours, a sharp wick through either level is possible without representing a genuine change in trend.
Glossary
Trendline: a line connecting a series of price highs or lows, used to visualize the direction and slope of a trend.
Fibonacci extension: a level used to estimate how far a move might extend beyond a prior swing.
Liquidation: the forced closing of a leveraged position when losses exceed available margin.
Whale concentration: the share of total supply held by the largest wallets.
Methodology
Price and chart levels in this official Trump price prediction are read directly from 1D (OKX) and 4H Binance-style charts on TradingView, screenshots dated July 18, 2026.
Liquidation figures come from a liquidation-tracking dashboard, futures volume figures come from an exchange volume heatmap, and holder concentration.
Figures come from an on-chain holder-analytics dashboard, all dated July 18, 2026. No level in this piece is extrapolated.
Beyond what these sources show, all price levels should be reconfirmed against live charts before publishing, since crypto prices can move meaningfully within hours.
Final Outlook: TRUMP Needs to Hold the Trendline, Not Just Touch It
According to Coingabbar market analyst, TRUMP's next move comes down to whether this bounce-off-the-trendline actually holds or fades back below it the way earlier attempts have.
The mixed liquidation data suggests both sides have already taken hits over the past 24 hours, and with OKX and Binance carrying most of the volume, a genuine follow-through should show up clearly on both.
Given how concentrated ownership is here, this is a setup where confirmation matters more than usual:
Hold above the trendline with real volume, and $1.883 comes into range; lose it again, and $1.496 becomes the level to watch on the way down.
Cryptocurrency markets are highly volatile, and this article is for informational purposes only; it should not be considered financial advice.
Always do your own research before making investment decisions.
Disclaimer: This Article is for informational and educational purposes only and does not constitute financial advice. Cryptocurrency markets are highly volatile. Do your own research and consult a licensed financial advisor before making any trading or investment decision.
Also read:
















