The Graph Price Prediction August 2026: $GRT Key Targets and Risks


The Graph is a decentralized indexing protocol that lets developers query blockchain data efficiently, according to its own project materials.
The Graph Price Prediction August 2026 looks at whether GRT stabilizes above $0.01443 over the next one to two weeks, a setup that would be invalidated by a confirmed close below that level.
Here's the full breakdown of what the chart and the liquidation data are showing.
The Graph Price Prediction: Market Overview and Price Movement
Metric | Value |
Price | $0.01443 |
24h Change | −3.22% |
Market Cap | $157.6M (−3.12%) |
Unlocked Market Cap | $133.41M |
24h Volume | $13.38M (+12.64%) |
Vol/Mkt Cap (24h) | 8.46% |
FDV | $167.65M |
Liq/Mkt Cap | 0.13% |
Total Supply | 11.6B $GRT |
Circulating Supply | 10.91B $GRT |
Profile Score | 70% |
Source: Data from CoinMarketCap as of 31/07/2026. Figures may vary slightly across other tracking websites.
GRT Liquidation and Volume Data
The Graph's futures market has seen a clear one-sided liquidation pattern over the past 24 hours: $15.45K in long liquidations in the last hour alone, rising to $20.00K over 4h and 12h windows, and $20.07K over 24 hours, with short liquidations sitting at $0 across every timeframe, per Coinglass. 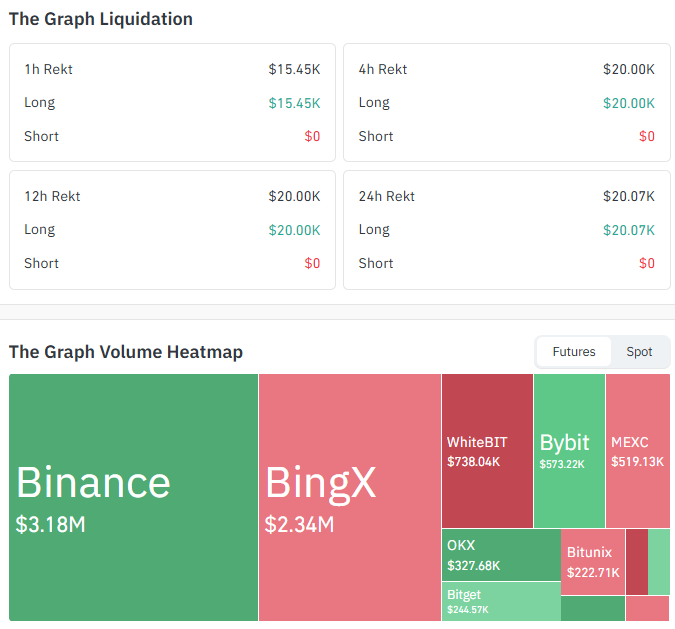
Source: Data From CoinGlass
That pattern points to leveraged long positions being forced out as price falls, rather than any short squeeze pushing price back up.
On the futures volume side, Binance ($3.18M) and BingX ($2.34M) account for the bulk of activity, with smaller volume spread across WhiteBIT, Bybit, MEXC, OKX, Bitget, and Bitunix.
This futures data is kept separate from the $13.38M spot volume figure in the market overview above, which comes from CoinMarketCap.
GRT Prediction Chart: Short-Term Technical Analysis
Pair: GRT/USDT · Exchange: KuCoin · Market: Spot · Timeframe: 1D · Source: TradingView · Timestamp: July 31, 2026, 11:09 UTC+5:30
$GRT trades at $0.01443, down 3.67% on the candle, still inside a descending channel that's been in place since a local high near $0.0193 in early July, with the price currently testing the channel's lower boundary.
Price sits well below both the EMA 20 ($0.01616) and EMA 50 ($0.01795) EMA (exponential moving average) readings that weight recent price action more heavily than a simple average, both of which cap the chart as overhead resistance alongside the $0.02000 level.
If the price breaks the channel, it could retest the EMA 20 and EMA 50 and could continue falling from there.
If the price breaks out of the channel and trades above these EMAs, that would suggest a trend change; until then, the price remains in selling within the upper and lower levels mentioned above.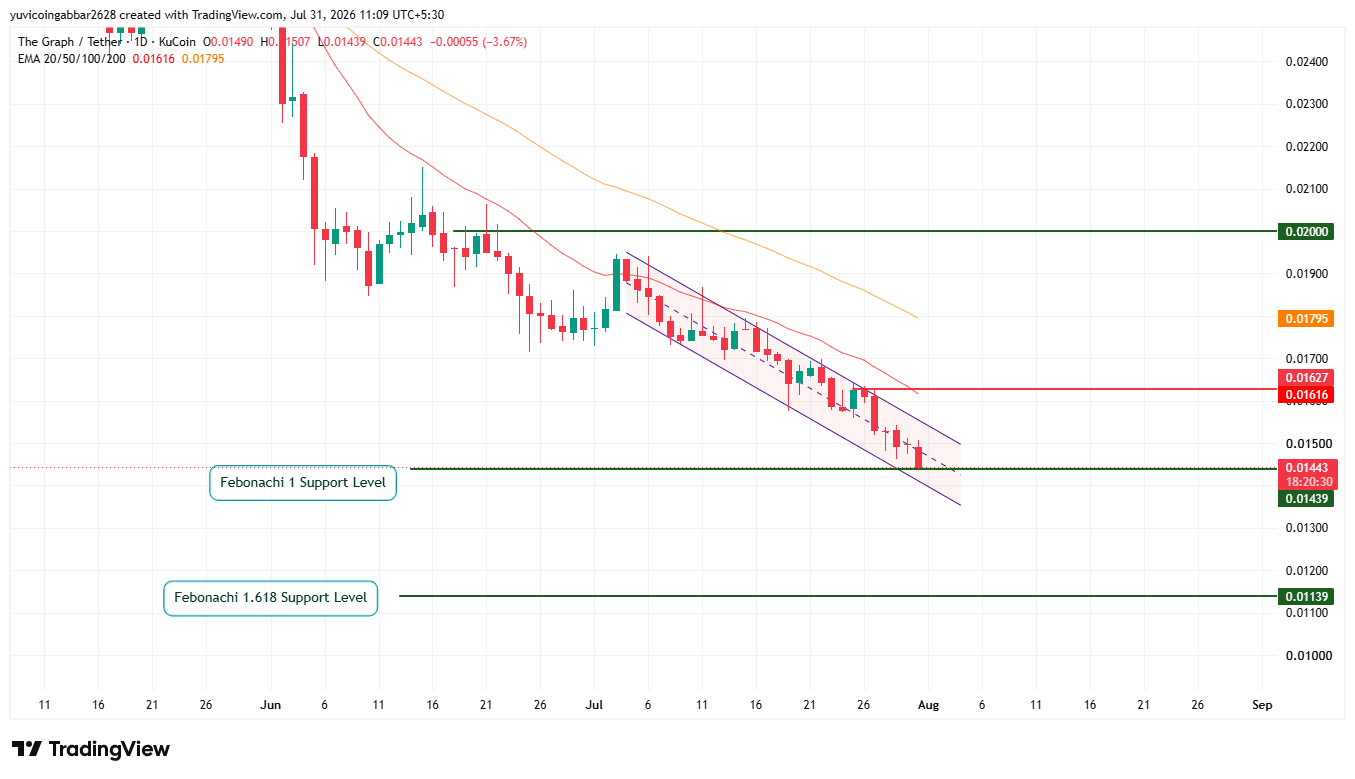
Level Type | Price |
Resistance 2 | $0.02000 |
Resistance 1 | $0.01627 |
Resistance (EMA 50 zone) | $0.01795 |
Initial Recovery Level (EMA 20 zone) | $0.01616 |
Immediate Price Reference | $0.01443 |
First Confirmed Support (Fibonacci 1 level) | $0.01439 + channel lower edge |
Deeper Support (Fibonacci 1.618 support) | $0.01139 |
GRT Forecast 2026: Long-Term Technical Analysis
Pair: GRT/USDT · Exchange: KuCoin · Market: Spot · Timeframe: 1W · Source: TradingView · Timestamp: July 31, 2026, 11:17 UTC+5:30
Zooming out to the weekly chart, GRT has been in a steep long-term decline from previous highs, with a multi-week consolidation between roughly $0.02015 and $0.02981 through early 2026 before the latest breakdown.
Price at $0.01443 sits far below both the EMA 20 ($0.02270) and the EMA 50 ($0.04411) on this timeframe, reflecting the depth of the longer-term downtrend. 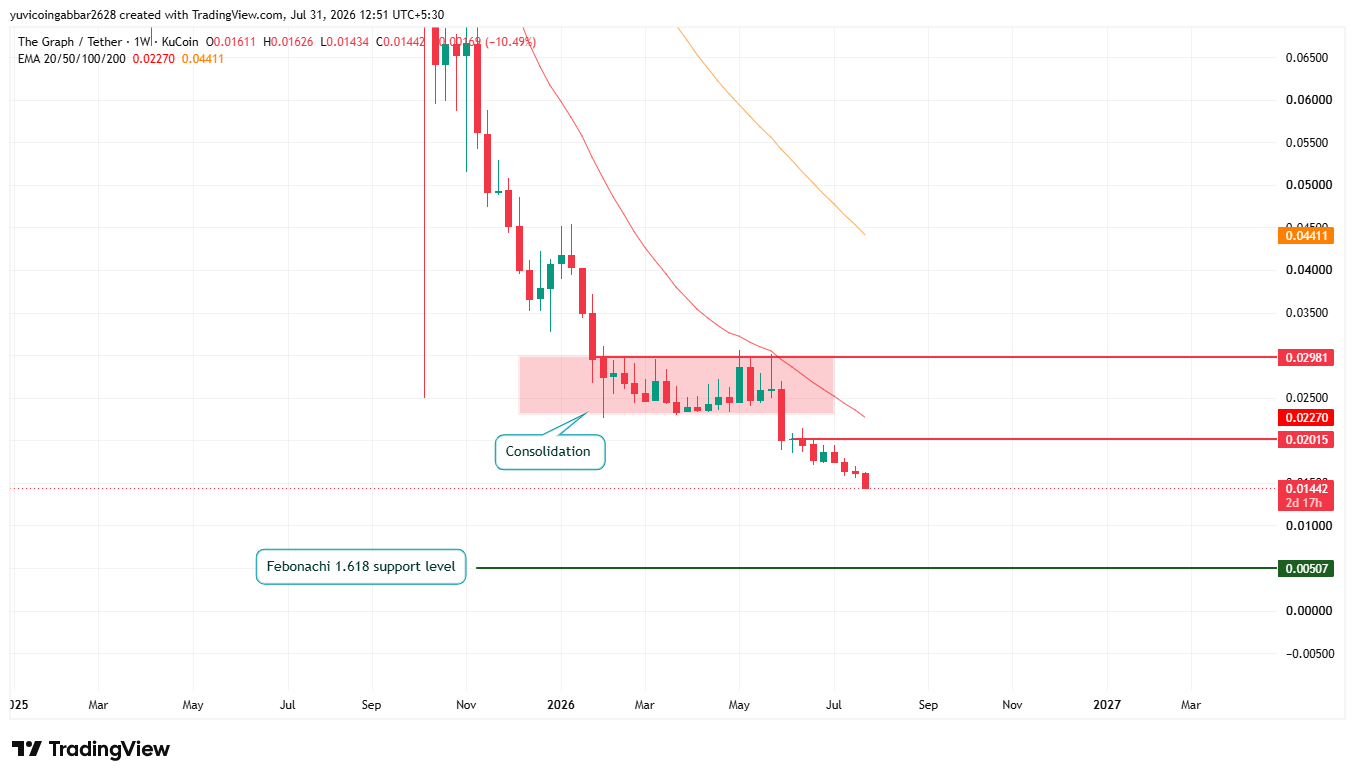
Two Fibonacci extension supports are marked well below the current price: $0.00507 (Fibonacci 1.618)
Level Type | Price |
Resistance 2 | $0.02981 |
Resistance 1 (EMA 20 zone) | $0.02270 |
Initial Recovery Level | $0.02015 |
Immediate Price Reference | $0.01442 |
First Confirmed Support (Fibonacci 1.618 support) | $0.00507 |
The Graph Forecast August 2026: Bull Case vs. Bear Case
Bull case: If GRT holds above $0.01439 (the daily Fibonacci 1 level) and reclaims the $0.01616–$0.01627 EMA 20 zone, the next target is $0.01795, with a longer-term stretch toward $0.02000 if the descending channel breaks. RSI-adjacent momentum and the one-sided liquidation flush add some odds to a short-term bounce, though the broader trend remains down.
Bear case: A confirmed close below $0.01439 would open a retest of the Fibonacci 1.618 support at $0.01139 on the daily chart, and continued weakness on the weekly timeframe keeps the long-term structure pointed.
The near-total concentration of liquidations on long positions suggests forced selling has been adding to the downside pressure.
Can GRT Reach the Graph Price Target of $0.02000?
A move to $0.02000, a stretch beyond the base bullish target, would require GRT to clear the $0.01616–$0.01627 EMA 20 zone and then the EMA 50 at $0.01795 on the daily chart, on a sustained basis.
That's a bigger ask than the near-term bull case above and would likely need the current descending channel to break rather than just a bounce within it.
What Could Invalidate the GRT Bullish Forecast?
A confirmed daily close below $0.01439 would undercut the near-term recovery case, and a break below the Fibonacci 1.618 support at $0.01139 would signal the downtrend is extending further.
Until $0.01439 is lost, the base case remains a consolidation near the channel's lower boundary rather than a fresh leg down.
GRT Short-Term Forecast: A Liquidation-Based Read
With all recent liquidations concentrated on long positions and none on shorts, per Coinglass, the market has largely been clearing out leveraged longs rather than seeing any short covering.
That kind of one-sided flush can precede near-term stabilization once forced selling runs its course, but it isn't a bullish signal on its own it only becomes one if the price actually holds above $0.01439 rather than continuing to bleed lower.
GRT Price Prediction Methodology
This forecast draws on multiple inputs rather than a single chart pattern: short and long-term market structure, the support and resistance levels on the daily and weekly charts, EMA momentum readings and Fibonacci extension levels, the shape of recent liquidation activity, and the broader downtrend context. No single data point is treated as decisive on its own.
The Graph Price Prediction August 2026: Expert View
According to CoinGabbar analysts, GRT's chart shows a clean downtrend on both the daily and weekly timeframes, with the price capped below both EMAs on each and still testing the lower boundary of its descending channel.
The derivatives market has been unusually one-sided in recent hours, with long positions absorbing nearly all the liquidation activity, which is consistent with a market still working through leveraged selling rather than one showing signs of a reversal.
The near-term question is whether $0.01439 holds as support or whether the broader downtrend extends toward the Fibonacci 1.618 support at $0.01139.
The Graph Price Prediction August 2026: Data Sources
Price, market cap, and supply data referenced from CoinMarketCap, as of 31/07/2026.
Liquidation and futures volume data referenced from Coinglass, as of July 31, 2026.
Chart analysis (EMA, support/resistance, Fibonacci extensions) sourced from a 1D GRT/USDT chart on KuCoin via TradingView, timestamped July 31, 2026, 11:09 UTC+5:30, and a 1W GRT/USDT chart on KuCoin via TradingView, timestamped July 31, 2026, 11:17 UTC+5:30.
Disclaimer: This piece is for informational purposes only and isn't financial advice. Crypto prices are volatile, and it's worth doing independent research before acting on any of the levels discussed here.











.jpg)






