Uniswap Price Prediction August 2026: Can $UNI Clear $4.36?


A quiet climb just turned into something worth watching, and Uniswap price prediction August 2026 searches are ticking up for a simple reason. The token that everyone wrote off during the DeFi lull is grinding back toward levels it hasn't touched since spring. Traders who gave up on it a few months back are checking the chart again. So is this the start of a real leg up, or another failed poke at resistance before sellers show up again?
Key Takeaways
UNI trades near $3.81, up about 3% on the daily candle, inside an ascending channel off the June low near $2.32.
Daily RSI reads 61.45, firm but not overbought, while weekly RSI sits at just 50.27, barely above neutral.
Daily resistance sits at $4.36, then $4.95. Support holds at $3.42, backed by a deeper floor near $2.77.
24-hour liquidations hit $493.65K, with longs taking $435.30K of that against just $58.34K short, a sign the squeeze phase has flipped.
Holder concentration is steep: the top 100 wallets hold 82.12% of supply, and the Gini score sits at 0.9976.
A fresh catalyst is in play too. Uniswap confirmed Robinhood Chain crossed $10 billion in protocol volume in under a month.
Why Uniswap Is Back On Traders' Radar
UNI trades near $3.81 as of the latest snapshot, up about 3% on the daily candle, a move visible on TradingView chart data. That bounce follows a stretch we covered in our breakout to the next rally piece.
Here's the thing: the daily chart and the weekly chart are telling different stories right now. One shows strength. The other shows a token still working through a longer repair job.
Turns out both can be true at once. A short-term bounce inside a longer-term wedge.
Technical Analysis: Daily Chart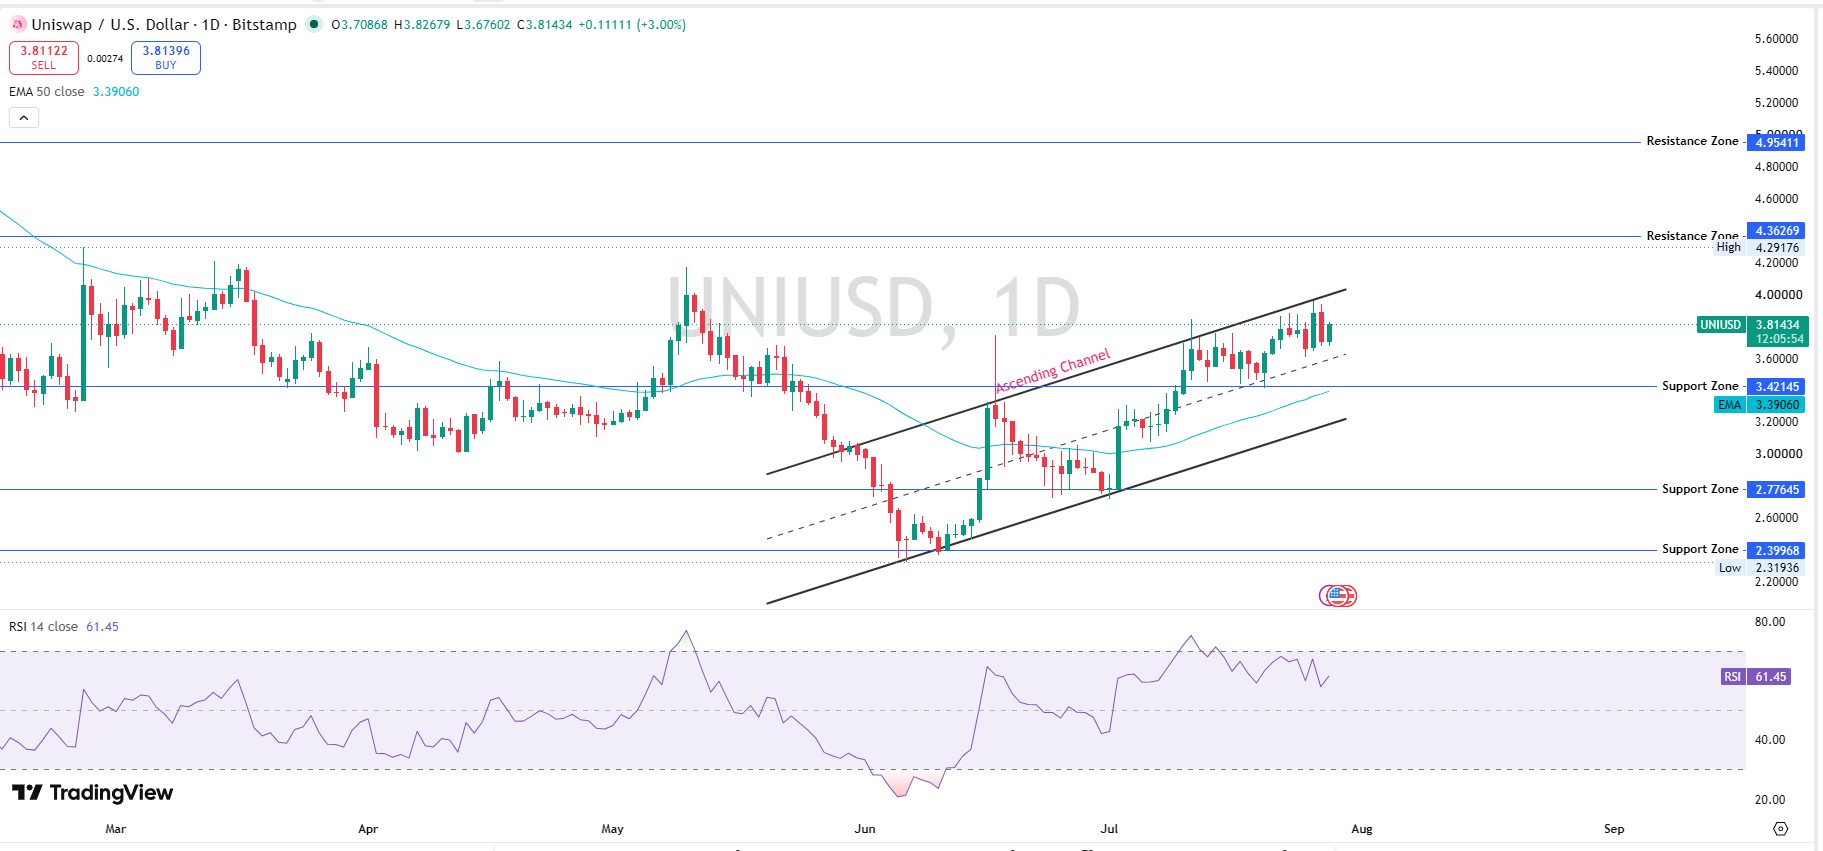
UNI opened at $3.70 and closed at $3.81, with the 50 EMA sitting well below spot at $3.39, confirming short-term momentum has turned up. Daily RSI reads 61.45, firm but not stretched.
Price is riding an ascending channel off the June low near $2.32, a setup we flagged early in our UNI ready for a big move coverage.
Resistance sits at $4.36, then a heavier zone near $4.95. Support underneath holds at $3.42, backed by a deeper floor around $2.77.
Technical Analysis: Weekly Chart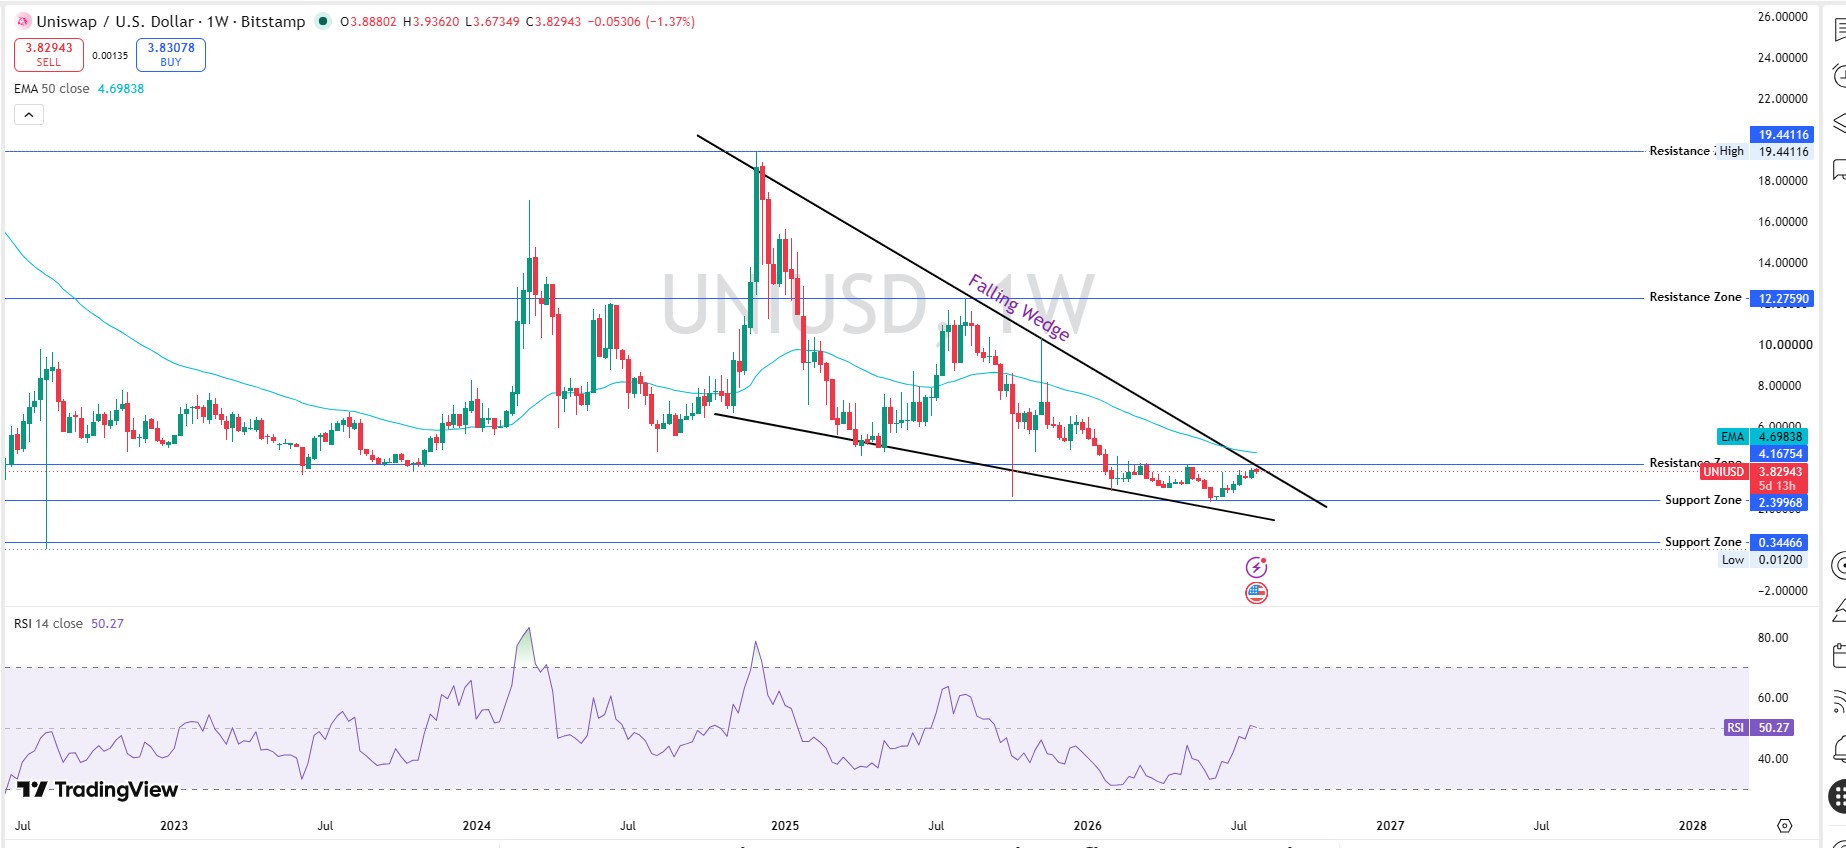
Zoom out and the picture is calmer. This week's candle closed slightly red, down around 1.37%, still holding inside a multi-year falling wedge that's held since 2024.
Weekly RSI reads just 50.27, barely above neutral, an odd gap against the daily strength.
Weekly resistance stacks at $12.28 and then $19.44, levels that feel distant from here, though not as distant as the targets discussed in our $100 UNI possible breakdown. But that distance is exactly why a clean wedge break would matter so much.
The Liquidation Snapshot
Short sellers have been paying today.
1-hour liquidations: $7.40K, all short. 4-hour: $24.01K, split $16.61K long against $7.40K short. 24-hour: $493.65K, with longs actually eating $435.30K of that against just $58.34K short.
That flip matters. Early in the move, shorts got squeezed, echoing the pattern we broke down in the $UNI rally or bull trap. Now longs are taking the bigger hit, a sign this rally isn't running on free momentum anymore, per Coinglass liquidation tracking.
Holder Concentration and the Robinhood Chain Angle
UNI's supply concentration is steep. Etherscan holder data shows the top 100 wallets hold 82.12% of supply, and the Gini score sits at 0.9976, close to maximum inequality. The largest wallet, the Uniswap V2 Timelock, holds 26.71% alone, a treasury position rather than a trading whale.
We pulled the futures heatmap too. Binance leads with $68.34M in 24-hour volume, followed by BingX and OKX near $30M each, a spread that looks healthier than a single-exchange squeeze.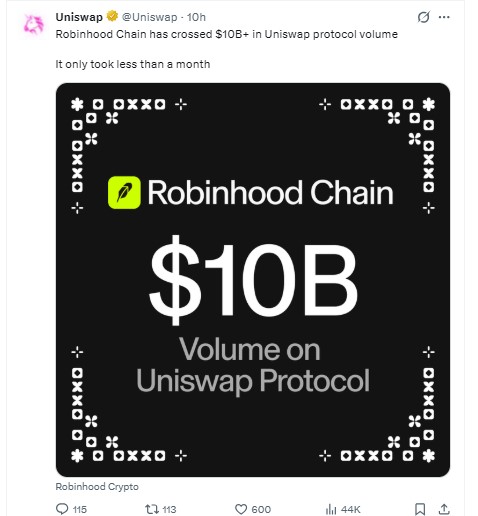
And there's a real catalyst underneath the chart. Uniswap's own account posted that Robinhood Chain crossed $10 billion in protocol volume in under a month, a milestone that lines up with this bounce and gives the move a fundamental leg to stand on, similar to the setup we covered in $UNI eyes major breakout.
Bull, Base, Bear
None of this is financial advice, just scenario ranges built from the current structure, sitting alongside the wider Bitcoin price prediction 2026 coverage for broader market context.
Bull: A daily close above $4.36 opens room toward $4.95 within 7 to 14 days. Probability near 35%. Invalidation: a close back below $3.60.
Base: Price chops between $3.42 and $4.36 for 7 to 30 days. Probability near 45%.
Bear: Momentum fades, and the price retests $3.42, then $2.77. Probability near 20%. Invalidation: sustained closes under $3.20.
Key Risks
Weekly RSI still under 50 despite the daily bounce. Whale concentration near 96% of tracked wallets. Distance from the $44.97 all-time high, still down over 91%. Wider market swings can override any single token's setup too, so it's worth checking the latest Ethereum price prediction for 2026 alongside this one.
What to Watch Next
Keep an eye on a daily close above $4.36. That's the level that opens the door toward $4.95.
Watch the weekly RSI too. It needs to clear 50 with conviction before the bigger wedge break gets taken seriously.
Robinhood Chain volume is worth tracking on its own. If it keeps climbing, that narrative could carry the next leg, and any fresh catalysts will likely show up first on the coin events calendar.
And don't ignore the liquidation flip. Longs are absorbing more damage now, so a stretch of calm here would matter more than another spike.
Disclaimer: This article is for informational purposes only and does not constitute financial advice. Cryptocurrency markets are highly volatile. Always do your own research and consult a licensed financial advisor before making investment decisions.