Uniswap Price Prediction: Is $UNI Rally Real or a Bull Trap?


Uniswap is trading at $3.82, up 1.0% over the last day, sitting right at a level chart watchers have flagged as important on more than one timeframe at once.
This uniswap price prediction looks at where UNI goes from here, especially with a protocol-level catalyst reportedly landing in the next couple of days.
If buyers can push through where price is stalling right now, UNI has room to run. If not, expect a pullback first. Either way, this is a live decision point, not a quiet chart.
UNI Price Today And Market Snapshot
Uniswap price today sits at $3.82, inside a 24-hour range of $3.74 to $3.88. Market cap is $2.389 billion on a circulating supply of 625.264 million UNI, out of a total supply of 892.398 million and a hard cap of 1 billion tokens. 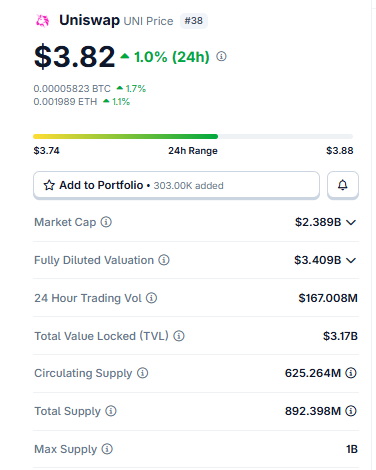
Source: Data Taken From Coingecko.data as of July 23, 2026. Figures may vary slightly across other tracking websites
Fully diluted valuation runs higher at $3.409 billion, worth keeping in mind since more than a quarter of the total supply still hasn't entered circulation.
Total value locked across Uniswap sits at $3.17 billion, and 24-hour trading volume is a healthy $167.008 million among the more active tokens in this kind of price range.
UNI Liquidation Data And Exchange Volume
Liquidation heatmap activity over the past 24 hours totaled $225.45K, split fairly evenly between longs ($117.78K) and shorts ($107.67K).
The shorter windows tell a slightly different story though: over the past 4 and 12 hours, liquidations have leaned heavily toward longs ($49.42K and $70.34K, respectively, against almost nothing on the short side).
Consistent with the minor pullback showing up on the 4H chart right now. 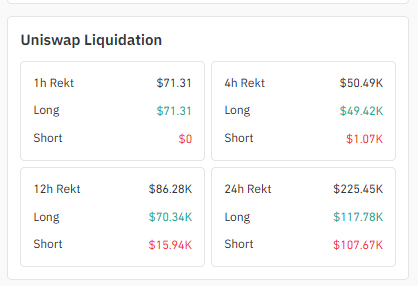
Source: Liquidation data taken from Coinglass, 23-07-2026
This suggests some leveraged longs got shaken out on the recent dip, even as the bigger 24-hour picture stays balanced.
Exchange volume is led by WhiteBIT at $147.23 million, well ahead of Binance at $85.24 million.
OKX ($38.60M), BingX ($35.12M), and Bybit ($20.61M) round out the next tier, with MEXC ($12.78M), LBank ($10.53M), Bitget ($10.19M), and Bitunix ($6.75M) making up smaller slices.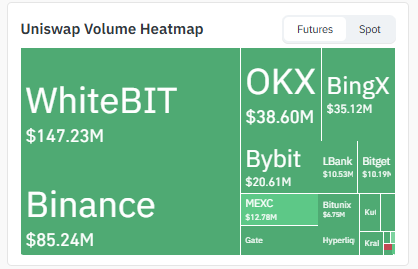
Source: Volume heatmap data taken from Coinglass, 23-07-2026
WhiteBIT carrying the largest share here is a bit unusual compared to most majors, and it means a genuine breakout confirmation should show real participation from WhiteBIT and Binance together, not just one venue.
UNI News And Social Sentiment
Social sentiment around Uniswap has picked up, with community accounts pointing to Robinhood's RH chain routing a significant share of its volume through Uniswap and highlighting that protocol fee revenue is running at multi-year highs. 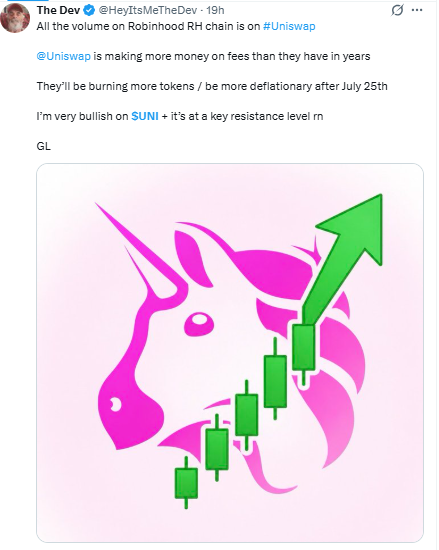
Source: Data Taken From X at 23-07-2026
There's also talk of an upcoming change that would make UNI more deflationary through increased token burning, reportedly tied to a date around July 25th, just a couple of days from now.
Worth watching, as always, treating social sentiment as a signal rather than a confirmed outcome until the change is actually live and its effects show up in the data.
UNI Holder Concentration
Holder data on Uniswap shows the top 100 wallets controlling 82.13% of tracked value, with whale-tier addresses, just 0.23% of all holders, accounting for 96.38% of market cap.
The top 5 wallets alone hold 44.43%, and the top 10 combined control 51.72%. There are 11 wallets that individually own at least 1% of the total supply.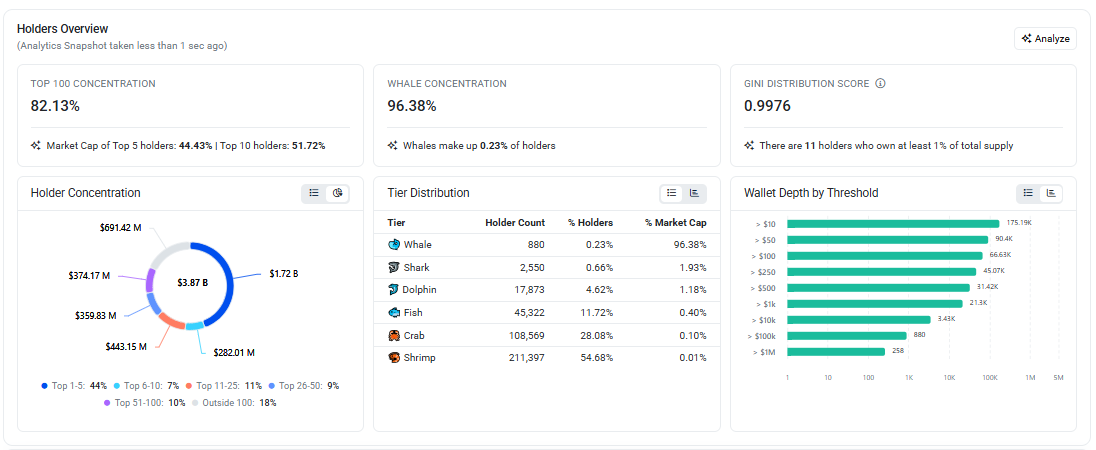
Source: Holder Data Taken From Etherscan, 23-07-2026
The Gini score here comes in at 0.9976, extremely concentrated even by crypto standards.
Breaking the tiers down: 880 whale wallets control 96.38% of value, 2,550 shark wallets hold another 1.93%, and the remaining tiers, dolphin, fish, crab, and shrimp, cover roughly 383,000 smaller addresses splitting the last 1.7% between them.
Over 54% of all tracked holders sit in the shrimp tier, controlling just 0.01% of value.
A holder concentration picture like this means a relatively small group of wallets has outsized influence over how UNI trades, worth factoring into how much weight to put on any single breakout attempt.
How UNI Stacks Up Against Other DeFi Names
| Token | Setup |
|---|---|
| Uniswap (UNI) | Testing the 4H trendline and 1D channel resistance together. |
| Aave (AAVE) | Tends to move with UNI given overlapping DeFi flows. |
| Lido (LDO) | Correlated through broader DeFi and staking sentiment. |
DeFi tokens often move together during sector-wide rallies or pullbacks, so it's worth glancing at how UNI's setup compares to peers before assuming this move is isolated. Always check live charts for current levels.
UNI 4H Chart: Trendline Holding, Two Paths From Here
Here's what the 4-hour chart is actually showing.
UNI has been climbing along a rising ascending trendline since around July 20, with price higher-lows stepping up from roughly $3.45 to where it sits now near $3.82.
The chart marks two clear outcomes from this point. If the trendline keeps holding as support, the drawn path shows price dipping slightly to retest around $3.70, then pushing up through $4.008 and on toward $4.210. 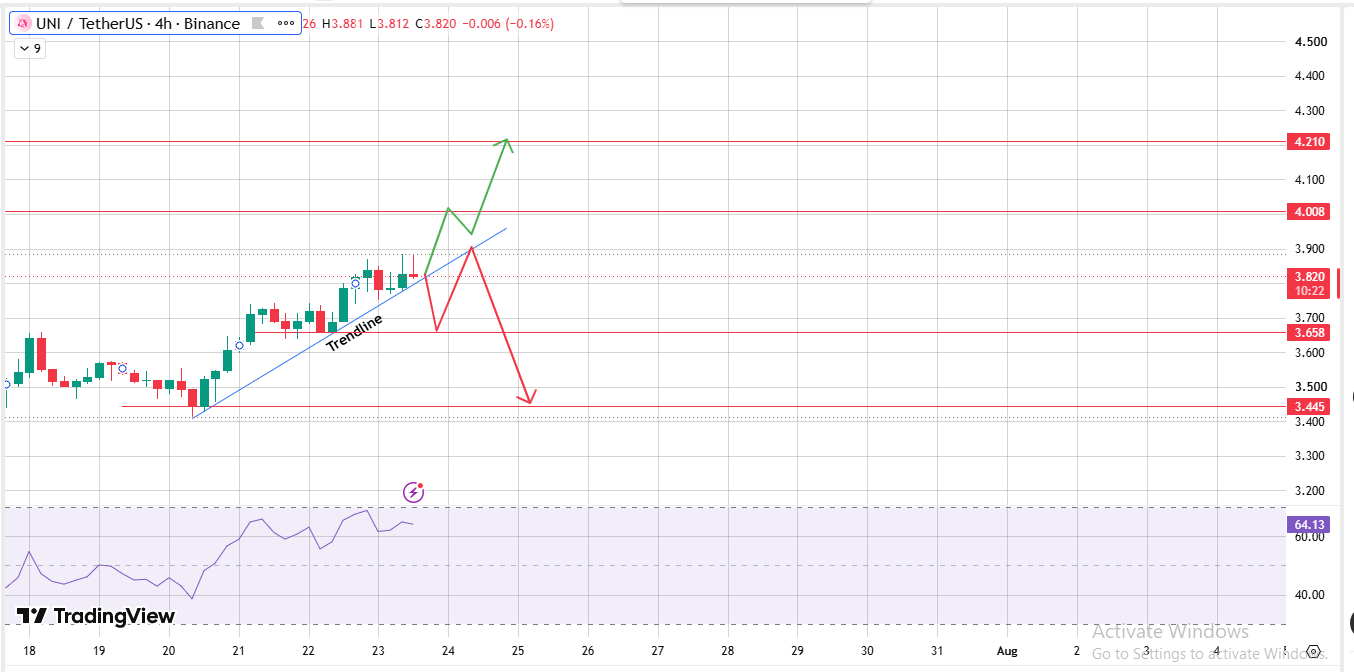
Source: Chart Taken From TradingView, 23-07-2026
That's the bullish path, a bounce off the trendline followed by a bullish breakout past both resistance level marks.
The alternative path on the same chart shows what a bearish breakdown would look like if that trendline breaks instead: price falls straight through $3.658 and continues down to the $3.445 support zone, essentially giving back the entire recent climb.
RSI on the 4H sits at 64.13, above the midline and leaning bullish, but not yet in overbought territory the way some other charts are right now.
So there's still room for this move to keep going if the trendline holds.
UNI 1D Chart: Price At The Top Of An Ascending Channel
Zooming out to the daily chart, the picture sharpens.
UNI has been rising inside a well-defined ascending channel since late June, with both the upper and lower boundaries clearly drawn, and the price is currently pressed right up against the top of that channel near $3.816–$3.885.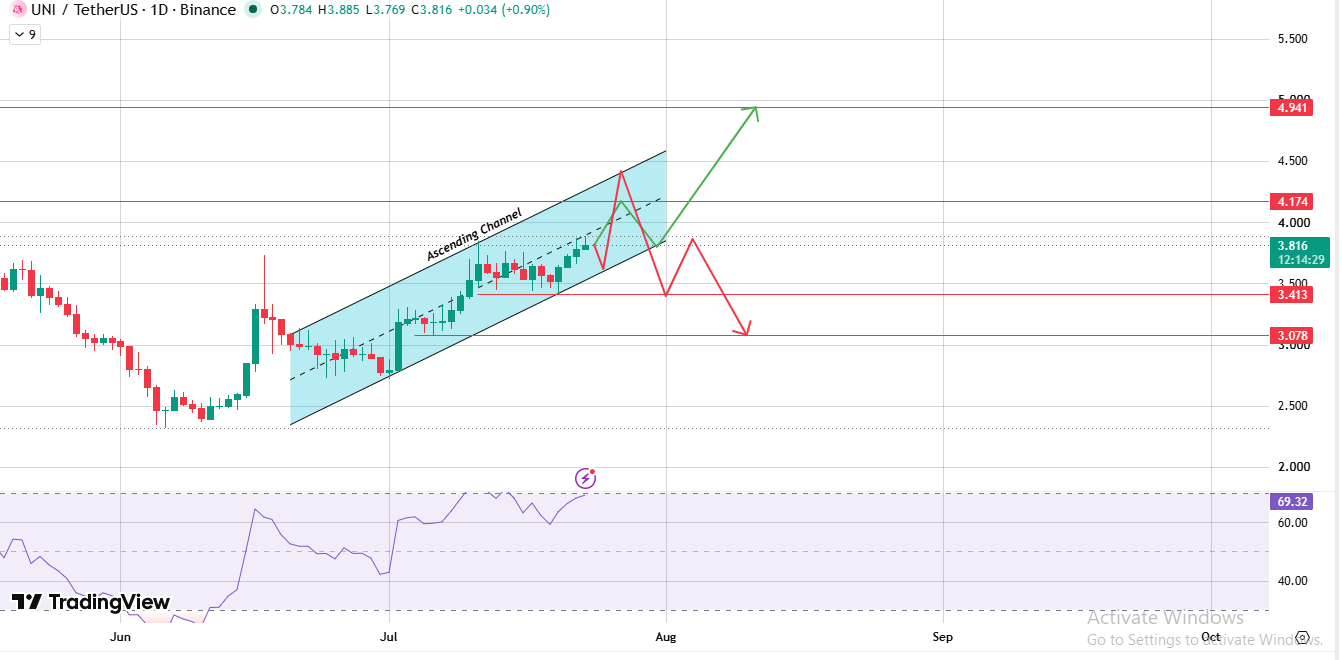
Source: Chart Taken From TradingView, 23-07-2026
It's the same decision point as the 4H chart, just playing out on a bigger scale.
If the price breaks out above the channel's upper boundary, the chart projects a run toward $4.174 first and $4.941 further out as the extended price target.
If instead the price gets rejected here and slips back inside the channel, $3.413 is the first support to watch, with $3.078 as the deeper floor if that fails too.
Daily RSI is at 69.32, right at the edge of overbought.
Combined with price sitting at the very top of the channel, this is the kind of setup where the next move, whichever direction it goes, tends to happen fairly quickly rather than dragging out.
UNI Price Prediction: Bull, Base, and Bear Scenarios
| Scenario | Trigger | Near-Term Target | Extended Target |
|---|---|---|---|
| Bull | The 4H trendline holds while the 1D channel breaks upward with strong volume. | $4.008 $4.174 | $4.210 $4.941 |
| Base | Price stalls at the top of the 1D channel, trading between $3.66 and $3.88. | Range-bound consolidation | RSI cools from overbought before the next directional move. |
| Bear | The 4H trendline breaks and the 1D channel support fails. | $3.658 $3.445 | $3.413 $3.078 |
Both charts are pointing at the same tension right now: UNI is testing resistance on two different timeframes at the same time, and RSI on both is elevated enough that a decisive move looks more likely than continued drifting.
Final Outlook: Is Uniswap Going To Go Up?
Both timeframes are lining up around the same tension. The 4H trendline and the 1D channel resistance are being tested together.
RSI is elevated on both without being maxed out, and there's a specific near-term catalyst in the fee-burn news that traders are already pricing into sentiment.
None of this guarantees a breakout, but it does mean the setup has more going for it than a random test of resistance usually would.
UNI doesn't move on its own either. BTC dominance and ETH correlation matter here since Uniswap sits close to Ethereum's ecosystem and tends to track broader DeFi sentiment as much as its own fundamentals.
If Bitcoin and Ethereum both stay calm, the $UNI channel breakout attempt has a cleaner shot at playing out on its own merits.
If the broader market turns volatile, expect this setup to resolve faster and with more noise than the charts alone suggest.
The levels that matter most: $4.008 and $4.174 as the first resistance zone, with $4.210 and $4.941 further out if the breakout confirms.
On the downside, $3.658 and $3.445 are the first supports on the 4H, with $3.413 and $3.078 as the deeper 1D levels if this turns into a real reversal.
Whether uniswap price prediction bulls get their move depends on whether the trendline and channel both hold at the same time, not on the fee-burn headline alone.
Quick Glossary
A trendline connects a series of rising lows, and traders watch it as a rough gauge of whether buyers are still stepping in on dips.
An ascending channel is the same idea with two parallel lines, one under the lows and one over the highs, and it gives a visual range for how price has been climbing.
RSI, or Relative Strength Index, is a 0–100 momentum gauge; above 70 usually flags overbought conditions, below 30 usually flags oversold, and readings in the 60s mean momentum is strong without being stretched yet.
A Quick Note On How This Was Put Together
Every level referenced here, the 4H trendline, the 1D channel boundaries, and every resistance and support number, came directly off the charts reviewed while writing this.
Nothing was extrapolated beyond what those charts actually show. Holder concentration and Gini score figures reflect a snapshot analytics pull taken at the time of writing.
Liquidation and exchange volume numbers are sourced from Coinglass-style data.
Price, market cap, and supply figures are a snapshot from July 23, 2026, so some of these numbers will have moved by the time you're reading this. Check a live chart before acting on anything here.
Disclaimer: This article is for informational purposes only and is not financial advice. Cryptocurrency markets are volatile; do your own research before investing.
Also read:

















