Uniswap Price Prediction: UNI Drops 10% Is the Uptrend Dead?

Uniswap has cooled off sharply after a strong summer run, and the Uniswap price prediction conversation now centers on whether UNI can hold its footing after a channel breakdown on the 4-hour chart.
The decentralized exchange token sits right above a key support cluster, and how it behaves there over the next few sessions could decide its next move.
UNI Price Snapshot
UNI trades at $5.984, down 12.62% on the day, per Coinglass data. For the UNI price prediction 2026 setup, market cap stands at $3.71B on a circulating supply of 622.01M against a total supply of 889.26M and max supply of 1.00B.
UNI open interest sits at $512.02M, with 24h futures volume at $787.06M and spot volume adding $153.76M.
Performance, Positioning and Liquidations
UNI is down 1.40% over 4 hours and 12.38% on the day, though still up 2.59% over 7 days.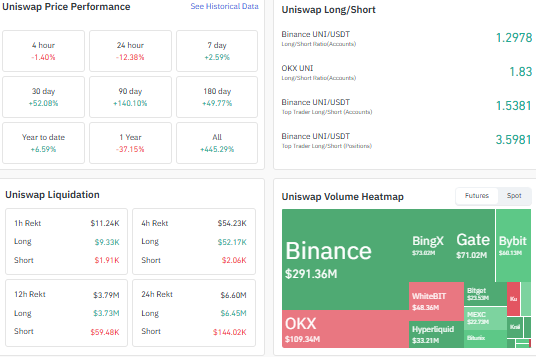
The 30-day and 90-day gains of 52.08% and 140.10% show how strong the prior run was, and the 180-day figure adds 49.77%.
Year to date UNI is up 6.59%, but the 1-year figure is down 37.15%, while all-time remains a massive 445.29%.
Positioning still leans long despite the drop, per crypto derivatives data.
Binance's long/short ratio by accounts reads 1.2978, and OKX shows a stronger 1.83, while Binance top traders are more aggressively long at 1.5381 by account and 3.5981 by position size.
Liquidations were heavy today, hitting $6.60M over 24 hours, almost entirely on the long side at $6.45M against just $144.02K in shorts, a clear sign leveraged longs got caught by the sudden move down.
Binance dominates trading at $291.36M, with OKX, BingX, Gate, and Bybit all contributing over $45M each.
Open Interest and Holder Concentration
Open interest built up steadily through the rally before this pullback. Per Coinglass chart data, OI held in the $150M to $250M range through most of the summer, spiked toward $320M in early August, cooled, then climbed sharply again to peak above $600M in early September, before easing back to the current $512.02M alongside the price drop.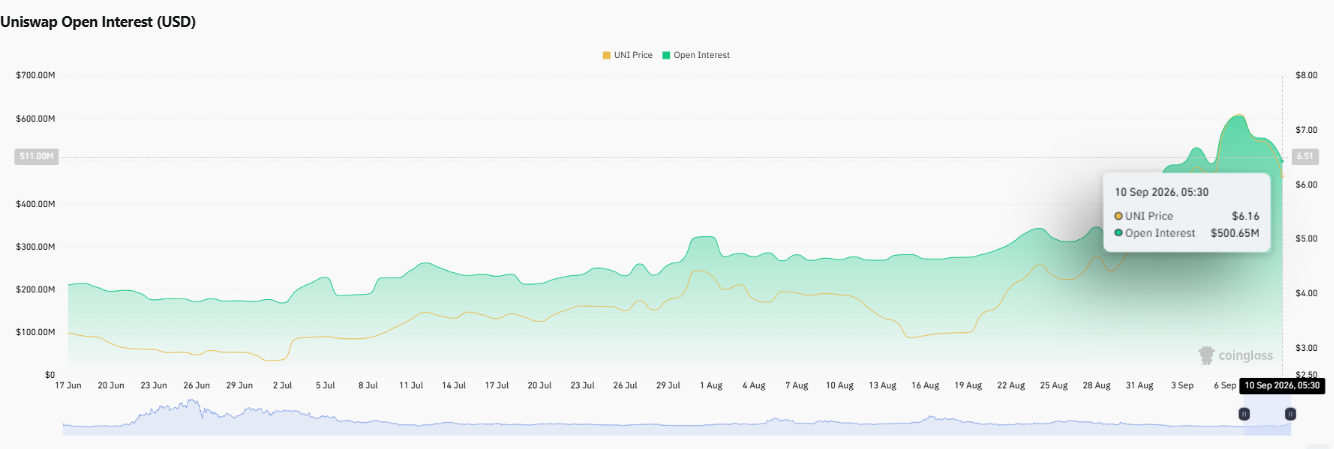
That pattern of OI cooling as price falls suggests recent leverage is being unwound rather than added to.
Holder concentration is a real factor too. On-chain data from Etherscan shows the top 5 holders control 45.63% of market cap and the top 10 control 52.37%, with a Gini score of 0.9976 and 11 wallets holding at least 1% of supply.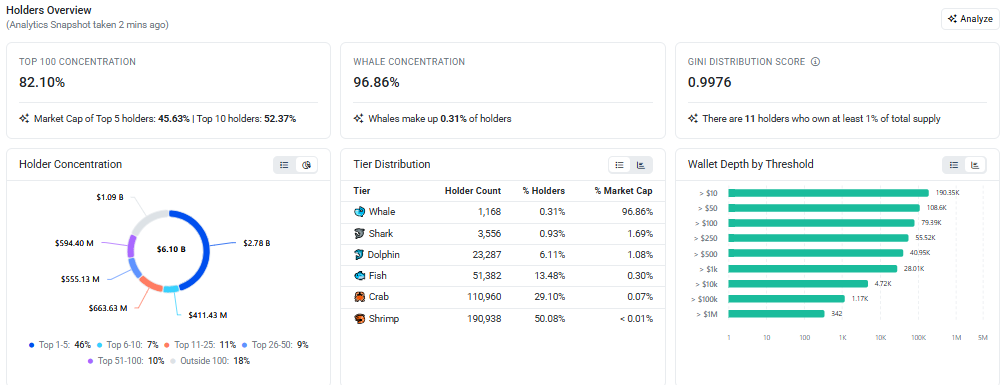
Whales make up just 0.31% of holders but 96.86% of holder-side market cap, so this on-chain holder data points to concentrated ownership for a token this large in the altcoin market.
Uniswap 4-Hour Chart Analysis
On the 4-hour chart, per TradingView chart data,UNI is showing a channel breakdown on the 4-hour timeframe and is now testing a support cluster at 5.6359, 4.9924, and 4.3573.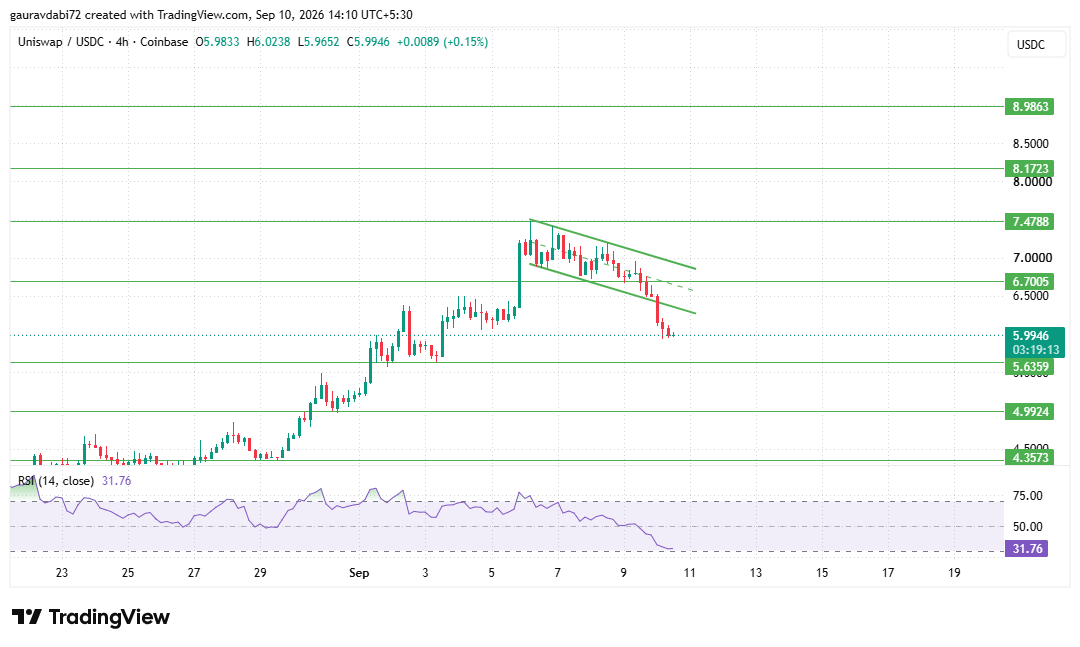
If that zone holds and price stabilizes, upside levels to watch are 6.7005, 7.4788, 8.1723, and 8.9863.
RSI(14) at 31.76 is deep in oversold territory, raising the odds of a relief bounce but not guaranteeing one with the structural breakdown still fresh.
Price Prediction: Outlook Ahead
The near-term Uniswap price prediction hinges on whether UNI can hold above 5.6359.
Anyone tracking UNI coin price prediction scenarios should watch for stabilization here, since a hold with RSI turning back up would favor a recovery toward 6.7005 and potentially 7.4788.
A break below 5.6359 opens the door to 4.9924 and 4.3573 next.
Key Risks to Watch
The sharp $6.60M in 24h liquidations, almost entirely on longs, shows how quickly leverage can flip after a fast move down, a real risk for any $UNI price prediction based on a quick rebound.
Whale concentration adds another layer, since a small number of wallets controlling most of the market cap means large moves from those holders can swing price meaningfully either way.
Expert Opinion
As per the CoinGabbar analyst desk, Uniswap's structure has weakened after the channel breakdown, and 5.6359 is the level that matters most right now.
Oversold RSI raises the chance of a short-term bounce, but a sustained recovery would need that support to hold and open interest to stabilize rather than keep unwinding.
Conclusion
Uniswap has pulled back hard from its summer highs, and the token is now testing a key support cluster after a 4-hour channel breakdown.
Whether UNI holds 5.6359 and works back toward 6.7005 and beyond, or breaks lower toward 4.9924, will likely define its next stretch.
Disclaimer: This article is for informational purposes only and should not be treated as financial or investment advice. Cryptocurrency markets are highly volatile, and readers should do their own research before making any investment decisions.
1 month ago
HOW TO GET A PROFESSIONAL RECOVERY EXPERT IN CANADA, UNITED STATES, MEXICO, INDIA, CHINA META TECH RECOVERY PRO META TECH RECOVERY PRO is a trusted, independent cyber-intelligence and digital recovery firm. We investigate and remediate sensitive information incidents across multiple blockchain and financial environments, including Bitcoin, USDT, USDC, Ethereum, and other widely used digital assets. Our mission is to help clients regain control, protect data, and restore integrity after unauthorized access, fraud, personal information exposure, or inappropriate online content. WhatsApp +1 469 692 8049 Using disciplined digital forensics and risk analysis, we provide end-to-end recovery support: tracing suspicious activity, identifying likely sources of cyber incidents, reconstructing event timelines, and performing secure data recovery when feasible. We also assist with consent-free exposure removal or erasure, including confidential records, private images, doxing-related content, and other materials that violate privacy standards. Contact them via Metatech@Writeme.Com Our method is professional and structured: each engagement begins with an assessment of incident scope, impacted platforms or accounts, and available indicators. We then apply targeted techniques such as digital footprint analysis, linkage evaluation across online identifiers, and verification of transaction or account trails to determine the most effective recovery and mitigation path. We operate under a NO UPFRONT fee model until completion, ensuring accountability, aligning incentives with client objectives, and reducing financial uncertainty. Clients typically seek help with hacked wallets or compromised accounts, suspicious crypto transfers, identity exposure, unlawful posting of private content, impersonation, online harassment, and other forms of digital wrongdoing.Reach out to them via - Telegram:@metatechrecoveryproteam - - WhatsApp: + 1 4 6 3 2 2 7 7 6 4 0 - - Call + 1 4 6 3 2 2 7 7 6 4 0 -

1 month ago
HOW TO GET A PROFESSIONAL RECOVERY EXPERT IN CANADA, UNITED STATES, MEXICO, INDIA, CHINA META TECH RECOVERY PRO META TECH RECOVERY PRO is a trusted, independent cyber-intelligence and digital recovery firm. We investigate and remediate sensitive information incidents across multiple blockchain and financial environments, including Bitcoin, USDT, USDC, Ethereum, and other widely used digital assets. Our mission is to help clients regain control, protect data, and restore integrity after unauthorized access, fraud, personal information exposure, or inappropriate online content. WhatsApp +1 469 692 8049 Using disciplined digital forensics and risk analysis, we provide end-to-end recovery support: tracing suspicious activity, identifying likely sources of cyber incidents, reconstructing event timelines, and performing secure data recovery when feasible. We also assist with consent-free exposure removal or erasure, including confidential records, private images, doxing-related content, and other materials that violate privacy standards. Contact them via Metatech@Writeme.Com Our method is professional and structured: each engagement begins with an assessment of incident scope, impacted platforms or accounts, and available indicators. We then apply targeted techniques such as digital footprint analysis, linkage evaluation across online identifiers, and verification of transaction or account trails to determine the most effective recovery and mitigation path. We operate under a NO UPFRONT fee model until completion, ensuring accountability, aligning incentives with client objectives, and reducing financial uncertainty. Clients typically seek help with hacked wallets or compromised accounts, suspicious crypto transfers, identity exposure, unlawful posting of private content, impersonation, online harassment, and other forms of digital wrongdoing.Reach out to them via - Telegram:@metatechrecoveryproteam - - WhatsApp: + 1 4 6 3 2 2 7 7 6 4 0 - - Call + 1 4 6 3 2 2 7 7 6 4 0 -

















