Memecore Price Prediction: Could M Break Toward $1.81?

This Memecore Price Prediction looks at where M stands, as it holds above a level that's supported by its recent climb.
MemeCore launched as a meme-focused blockchain project built around community-driven token culture, and it has grown into an established name in that category, currently ranked #38 by market cap.
Memecore price today is $1.20, up 0.8% over the last 24 hours. Price has ranged between $1.16 and $1.23 during this period, and the market cap stands at $2.73B.
Live Market Data
Metric | Value |
Price | $1.20 |
Market Cap | $2.73B |
Fully Diluted Valuation | $6.507B |
24-Hour Trading Vol | $1.298M |
Circulating Supply | 2.271B M |
Total Supply | 5.413B M |
Max Supply | 10B |
Memecore Exchange Volume
MemeCore's futures activity is led by BingX at $2.33M over the past 24 hours.
Binance follows at $1.63M, with LBank next at $1.36M. KuCoin and WhiteBIT contribute $993.11K and $886.42K. 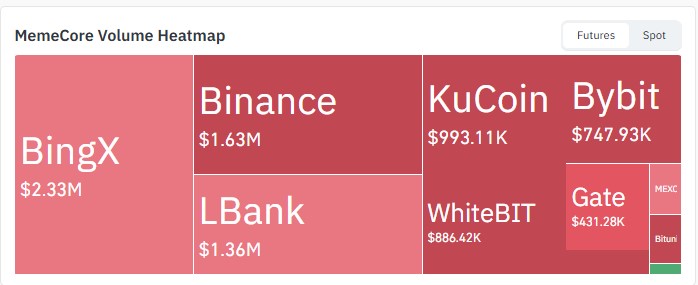
Source: Volume Heatmap Data Taken From CoinGlass, As of Sept 10, 2026.
While Bybit adds $747.93K and Gate brings in $431.28K. The remainder is spread across MEXC and Bitunix.
Memecore Price Prediction: Technical Outlook
On the daily M/USDT chart on Bitget, the price is holding above a rising trendline that has supported the market since early August. 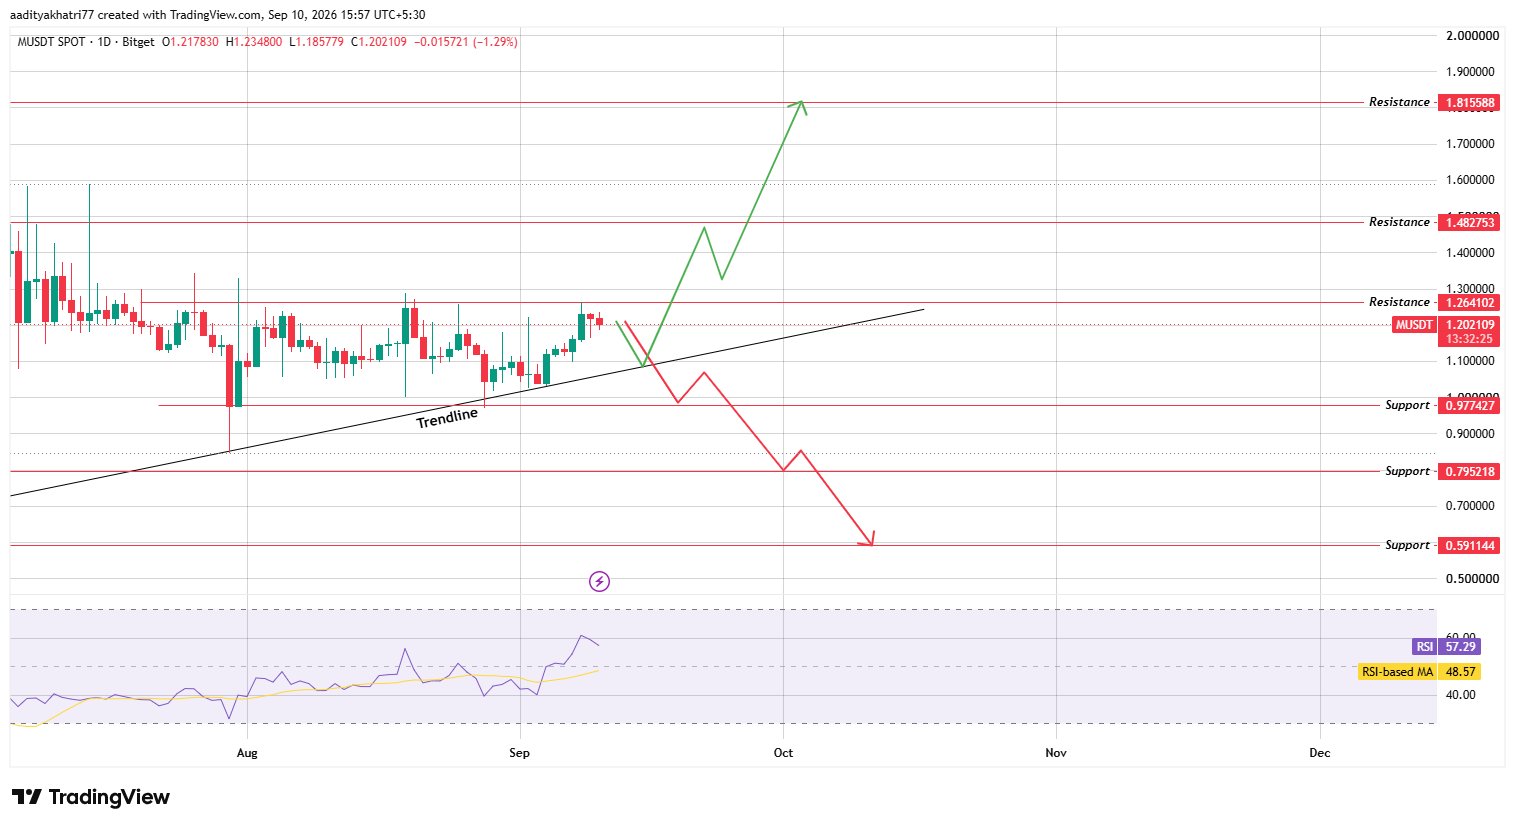
Source: Chart Taken From TradingView, as of Sep 10, 2026
$M recently pulled back toward that trendline and is now testing it as support. RSI stands at 57.29, above its moving average of 48.57, indicating that momentum remains constructive despite the recent pullback.
Could $M Break Toward Higher Resistance?
If M bounces off the rising trendline and then breaks above $1.264102 with rising volume, that would confirm a move toward the next resistance zone.
Clearing that level on continued strength opens the path to $1.482753, with $1.815588 as the next resistance if buying pressure extends further.
What Happens If $M Breaks the Rising Trendline?
If instead the price breaks below the rising trendline with volume confirming the move, the first support to watch is $0.977427.
A failure to hold that level could send M toward $0.795218, with continued weakness putting $0.591144 in view.
Support and Resistance Levels
Support | Resistance |
$0.977427 | $1.264102 |
$0.795218 | $1.482753 |
$0.591144 | $1.815588 |
Bull, Base, and Bear Scenarios
Scenario | Setup | Level |
Bull | Bounce off trendline, break above resistance on volume | $1.264102–$1.815588 |
Base | Price consolidates near the trendline | $1.10–$1.25 |
Bear | Break below the rising trendline on volume. | $0.977427–$0.591144 |
A rising trendline connects a series of higher lows, and holding above it is generally read as a sign that buyers remain in control of the trend, while a bounce off that line is often treated as a short-term signal of continued strength.
RSI measures how fast and how far price has moved recently, helping traders judge whether momentum is building or fading.
Support and resistance describe the price zones where buying or selling pressure has previously been strong enough to pause or reverse a move, and a breakout above resistance following a trendline bounce is typically viewed as a stronger signal than either move on its own.
M vs Bitcoin
MemeCore's price action still largely follows the broader crypto market's direction rather than moving independently.
When Bitcoin trades with more conviction, M's breakout or breakdown scenarios above tend to play out with added force, a reflection of how closely a token at M's liquidity level continues to lean on overall market sentiment.
Methodology
This Memecore Price Prediction is based on daily candlestick data from Bitget, RSI readings, and the rising trendline structure that has supported the chart since early August 2026.
The scenario levels above are tied to specific breakout or breakdown conditions and are not guaranteed outcomes.
Expert Opinion
Market commentators following M's setup note that a bounce off a rising trendline followed by a resistance breakout is typically read as a stronger continuation signal than either event happening in isolation.
Their view is that the current pullback toward trendline support is a normal part of an uptrend, provided that support continues to hold on subsequent tests.
Disclaimer: This Memecore Price Prediction is for informational purposes only and should not be treated as financial advice. Cryptocurrency markets are highly volatile, technical patterns can fail to play out as expected, and any of the scenarios described above carry a realistic probability of not occurring. Readers should conduct independent research before making any investment decisions.
Also read:

















