UP Price Prediction: Can Robinhood-Listed Token Extend 36.3% Rally?


A token most traders had never heard of a week ago just posted one of the sharpest moves on the charts today. Turns out, timing and a Robinhood listing can do that. What happens next is the part nobody agrees on yet.
UP Token Just Woke Up: Here Is Why Everyone Is Talking About It
UP price prediction searches are climbing right along with the chart itself. Somewhere between a Robinhood listing, a fresh CoinGecko badge, and shifting altcoin market trends, this token found an audience it did not have a week ago.
Basically, a small DEX token turned into a talking point overnight.
It's not hype without a reason, though. There's a real product behind the ticker, real volume across exchanges, and a community that showed up fast.
But is this the start of something bigger, or just a loud first week that fades by next month?
$UP Token Overview: Snapshot Of Where UP Stands Right Now
$0.06192
| Metric | Value |
|---|---|
| Coin Name | up. |
| Ticker Symbol | UP |
| Blockchain | Ethereum (ERC-20) |
| Today High | $0.1145 |
| Today Low | $0.06192 |
| RSI Level | 58.79 |
| Token Type | Utility and Governance |
| Token Category | Decentralized Exchange (ve33 DEX) |
| Market Cap | $50.13M |
| 24H Trading Volume | $373,740 |
| Circulating Supply | 500,000,000 UP |
| 24H Change | +36.3% |
Source: Data by CoinGecko
What Exactly Is up. And Why Is It On Robinhood
$UP is a decentralized exchange built on the ve33 model, where $UP trades freely and locked positions called veUP handle voting and fees. It went live on Robinhood on July 11.
People care because excess emissions get burned instead of dumped on the market, a direct swing at a problem that has drained value from older DEX tokens for years.
Price History And Performance Since Launch
The token's all-time high sits at $0.1145, hit on July 14. Its all-time low of $0.05685 came just one day before that. Basically, this entire trading history is a few days old.
Why This Coin Matters Now Beyond The Chart
Three announcements landed inside a week: a CoinGecko listing, Dexscreener verification, and confirmation that up. burns excess emissions instead of releasing them.
Most ve33 forks inflate supply quietly until holders notice the dilution.
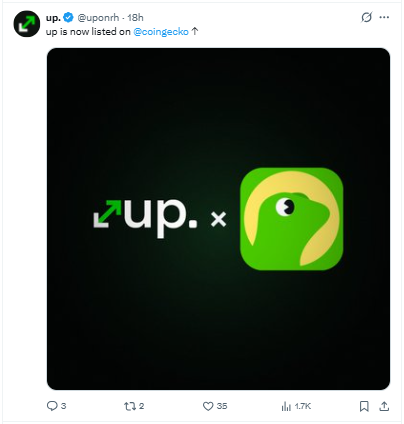
$UP Team Confirms CoinGecko Listing Goes Live
The team posted confirmation of that. is now listed on CoinGecko, a step that usually widens visibility for a token still building its first real order book.
Source: Posted on X by uponrh
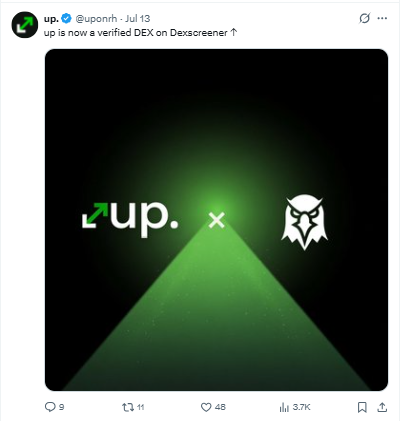
Dexscreener Verification Removes An Early Warning Flag
$UP also picked up verified status on Dexscreener. Before this, unverified pools carried a warning label that quietly scared off cautious buyers.
Source: Posted on X by uponrh, up is now a verified DEX on Dexscreener
Fundamental Analysis: Tokenomics Built Around Commitment
87.5% of Genesis's supply started locked as veUP instead of sitting liquid, which is unusual given recent blockchain crypto news on token unlocks. That covers the community allocation, ecosystem fund, foundation slice, and contributor reserve.
Here's the thing: only the incentive budget and seed liquidity trade freely at launch. Everything else earns fees and votes, not selling pressure.
The 200,000,000 UP airdrop pays out epoch after epoch to lockers, voters, and active traders, spreading out sell pressure instead of concentrating it on day one.
$UP Technical Price Analysis: Ascending Triangle Sets The Tone
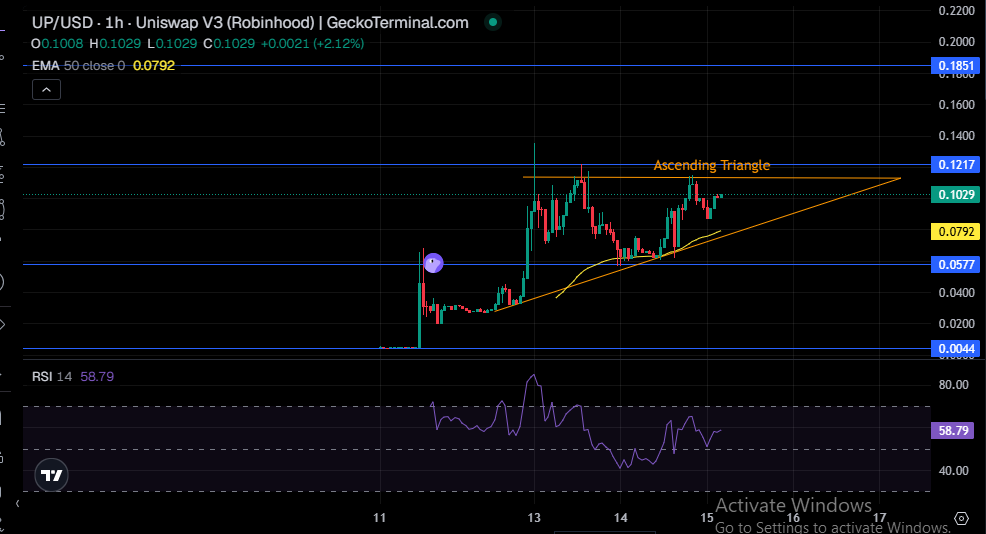
Price is pushing against an ascending triangle on the 1-hour chart, sitting above its 50 EMA near $0.0792. Buyers have held the higher low structure for days now.
Source: Charting by Gecko Terminal
Here's the thing: every dip since launch has found buyers earlier than the last one. That's the pattern behind an ascending triangle, and it's exactly what's showing up on this chart right now.
The flat top near $0.1217 has been capped twice already. But each retest has come with a slightly higher low underneath it, which is usually a sign of accumulation rather than exhaustion.
RSI at 58.79 backs that up. Not stretched, not weak, just steady momentum with room left before it looks overbought. It's held above the midline through the entire consolidation, and that matters more than the number itself.
Basically, sellers have not been able to push RSI back under 50 even once. That's a tell worth watching.
Resistance sits at $0.1217 first, then $0.1851 above that.
Support below is thinner, and $0.0577 is the line bulls need to defend.
Volume around the triangle apex has been drying up slightly, which is normal before a real breakout attempt. A move on rising volume, in either direction, is what confirms this pattern one way or the other.
UP vs Other Small-Cap DEX Tokens Right Now
UP's Ethereum base and Robinhood listing give it a wider retail funnel than most microcap DEX tokens get early on.
UP Short Term Price Prediction: What The Next Few Weeks Could Bring
The near-term setup still leans on that triangle holding, a pattern that plays out often across top memecoins before a real breakout. A breakout confirms momentum; a breakdown resets the whole conversation fast.
| Timeframe | Bearish Target | Base Target | Bullish Target | Key Trigger |
|---|---|---|---|---|
| 24 Hours | $0.089 | $0.103 | $0.118 | Triangle breakout attempt |
| 3-7 Days | $0.077 | $0.110 | $0.145 | Volume follow-through on breakout |
| 2-4 Weeks | $0.058 | $0.125 | $0.185 | Sustained buyer demand above EMA |
Watch the $0.0577 line closely. Everything bullish here depends on price staying above it.
UP Long-Term Price Prediction: The 2026 And 2027 Outlook
Longer term, this comes down to the burn mechanism and Airdrop model drawing in real users, not just short-term flippers.
| Timeframe | Bearish Target | Base Target | Bullish Target | Catalyst Needed |
|---|---|---|---|---|
| 3 Months | $0.045 | $0.135 | $0.220 | Continued exchange listings |
| 6 Months | $0.035 | $0.160 | $0.310 | Growing TVL and fee revenue |
| End of Year | $0.028 | $0.190 | $0.420 | veUP lock rate staying high |
| 2027 Outlook | $0.020 | $0.230 | $0.550 | DEX volume share gains vs rivals |
We'd call the long-term case promising but unproven. Four days of trading history is not a track record yet.
Three UP Price Scenarios Traders Are Watching Closely
Worst Case: Whale wallets holding over 97% of the supply start distributing to retail demand. Broad market weakness would accelerate this fast.
Base Case: Price grinds along the triangle, testing resistance more than once before a clean break. Volume stays moderate for a few weeks.
Best Case: A confirmed breakout above $0.1217 draws in momentum traders and exchange attention. Sustained volume above the 50 EMA is the tell.
| Scenario | Price Range | What Triggers It |
|---|---|---|
| Worst Case | $0.02 - $0.045 | Whale distribution, weak broader market |
| Base Case | $0.09 - $0.14 | Sideways consolidation inside the triangle |
| Best Case | $0.18 - $0.42 | Confirmed breakout with strong sustained volume |
Key UP Price Levels Every Trader Should Be Watching
Resistance zone: $0.1217 first, then $0.1851. A close above the first level on strong volume is the real confirmation signal.
Support zone: $0.0577 is the level bulls need to defend. Losing it flips the short-term structure bearish.
Invalidation zone: $0.0044. A close beneath this would undo the entire bullish thesis built since launch.
UP Analyst View And Final Thoughts On Where This Goes Next
When we pulled up the chart, the first thing that stood out was how clean the ascending triangle looks for a token barely a week old. That's rare.
RSI at 58.79 gives buyers room to keep pushing. But a weekly close above $0.1217 is what confirms the next leg, not just a wick through it.
One thing worth tracking beyond the chart: top ten wallets hold nearly 98% of the supply, and broader mood on the crypto fear and greed index matters too. Whale behavior will move price faster than any single indicator will.
The Ethereum ecosystem backdrop matters too, since UP's fortunes are tied loosely to gas costs on the chain it runs on.
$0.0577 decides the next two weeks. Hold it, and the setup stays bullish. Lose it, and this turns into a very different story.
Disclaimer
This article is for educational purposes only and does not constitute financial advice. Crypto markets are volatile. Consult your investment advisor before making any investment decision.

















