Velvet Price Prediction: Can VELVET Sustain Its 124% Rally?

VELVET has gone from a quiet, range-bound token to one of the more talked-about movers on trading desks this week.
After weeks of sideways drift, the chart has broken into a fresh uptrend, volumes across major exchanges have picked up, and futures traders are suddenly paying close attention.
But is this move built on solid ground, or is it running ahead of itself?
This Velvet price prediction breaks down what the price action, derivatives data, and chart structure are actually saying before the next leg unfolds.
What's Driving the VELVET Rally Today?
$VELVET is trading around the $1.00 mark, up 22.47% on the day and roughly 124.63% over the past week.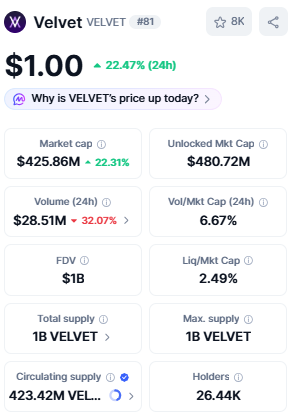
Market cap data shows the figure has climbed to $425.86M, up 22.31% alongside the price.
Interestingly, 24-hour trading volume has actually pulled back 32.07% to $28.51M, even as the price pushed higher, a sign that this leg has been driven more by directional conviction among existing holders than a fresh wave of new volume.
For more on why VELVET is surging today, momentum has clearly been the dominant driver this week.
Data source: CoinMarketCap
Momentum Doing the Heavy Lifting
The move appears largely driven by technical momentum and positioning rather than a specific news trigger.
In some ways, the setup echoes a breakout pattern seen earlier this year, where a similar range-to-trend transition preceded a sharp move.
That makes the $Velvet price prediction outlook from here largely a function of chart structure and derivatives positioning, both of which point to a market that's turned decisively bullish in the short term but hasn't yet been fully tested.
What Are Futures Traders Signalling?
Binance dominates VELVET futures trading volume with $102.10M, well ahead of MEXC ($25.72M), Bybit ($22.79M), Bitget ($18.49M), Gate ($14.14M), Bitunix ($9.14M), and BingX ($5.73M).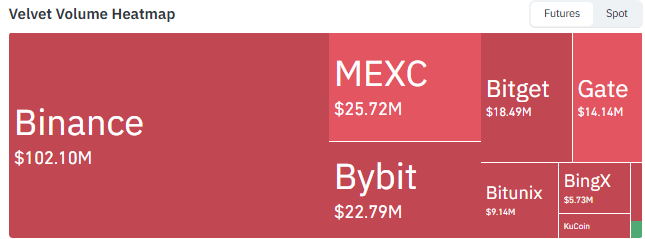
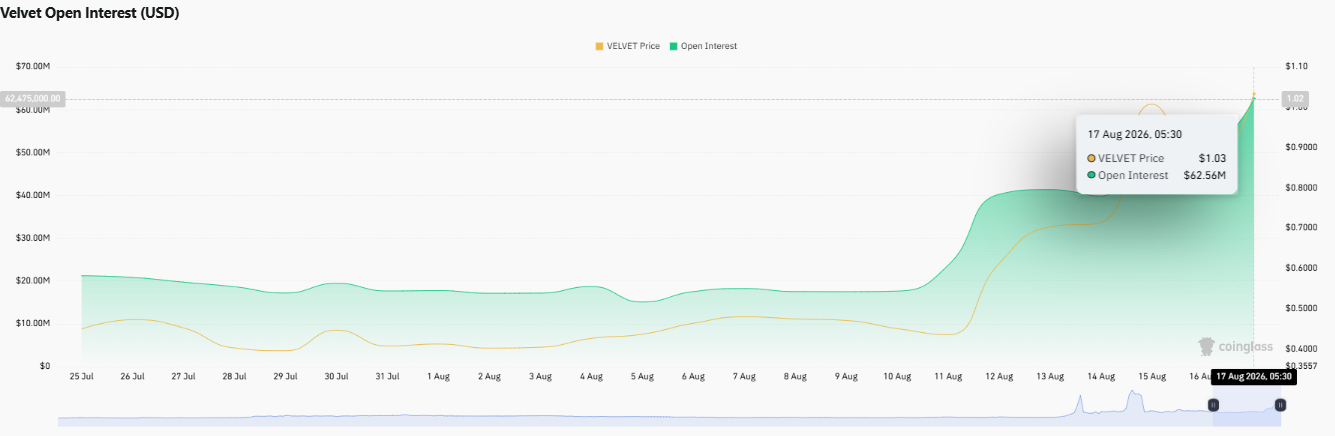
Open interest has surged from roughly $20M in early August to $62.56M as of 17 August 2026, tracking closely with VELVET's climb from around $0.50 to just above $1.00, a sign that fresh positions, not just price appreciation, are fueling the move.
Positioning is a little mixed. Binance's account-based long/short ratio sits at 0.6686, and top trader accounts show a similar 0.5664 ratio; both point to more short-biased accounts on the platform.
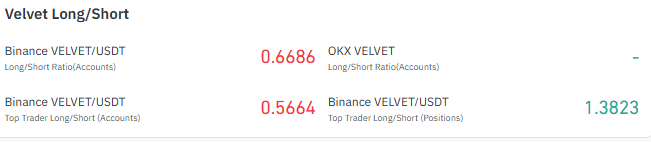
Yet the top trader position-weighted long/short ratio stands at 1.3823, meaning that by position size, the larger positioning is actually leaning long.
That gap between account count and position weight is worth watching and ties into the broader VelvetX ecosystem narrative that's been building around the token.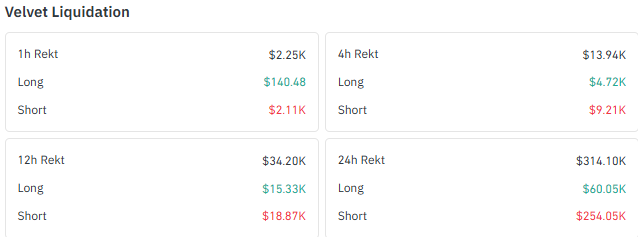
Liquidation data backs up the squeeze narrative: total 24-hour liquidations came in at $314.10K, with short positions accounting for $254.05K of that versus just $60.05K on the long side, consistent with a rally that has been catching short sellers offside.
Data sourc: CoinGlass
VELVET's Chart Structure: Range Breakout Into an Ascending Channel
On the TradingView 4-hour chart, $VELVET spent an extended period consolidating in a tight range before breaking higher into an ascending channel pattern, with price carving out higher lows along the channel's lower boundary.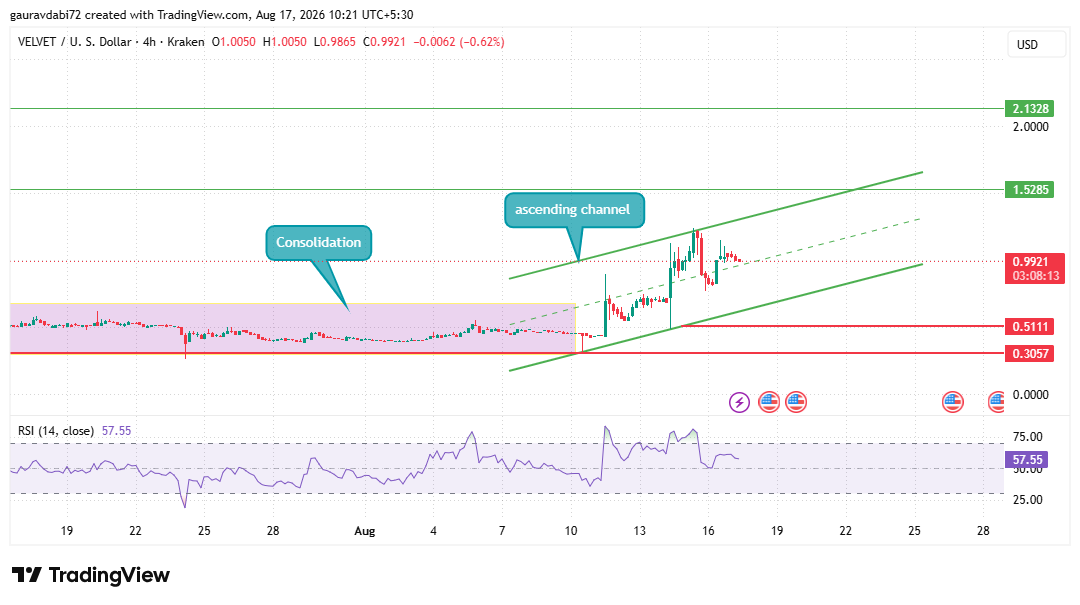
That kind of transition from a flat base into a rising channel typically needs confirmation through a clean close above the recent swing highs and a successful retest of the breakout zone before it can be treated as an established trend rather than a one-off spike.
Key Levels to Watch on VELVET's Chart
Support sits at $0.5111, with a deeper cushion at 0.3057 if the current advance unwinds sharply.
On the upside if the channel breakout; the resistance is layered at $1.5285, $2.1328, and $2.9907.
The 4-hour RSI (14) reads 57.55, a neutral-to-bullish reading that leaves room to run before the token enters overbought territory.
Velvet Price Prediction: Bull, Neutral and Bear Scenarios
Bullish Case | Sustained buying above the $1.00 mark, backed by steady volume, could push $VELVET toward the $1.5285 resistance. A decisive move past that level would bring $2.1328 into focus, with $2.9907 as the next major level to watch further out. |
Neutral Case | $VELVET consolidates between the breakout zone and $1.5285 while the ascending channel and RSI cool off, digesting the recent surge before the next directional move. |
Bearish Case | A break below the ascending channel's lower boundary sends VELVET back toward the $0.5111 support, with the $0.3057 zone acting as the deeper cushion if selling pressure builds. |
How Has VELVET Performed Recently?
Over the past 4 hours, $VELVET slipped 2.37%, a mild pullback within an otherwise strong run.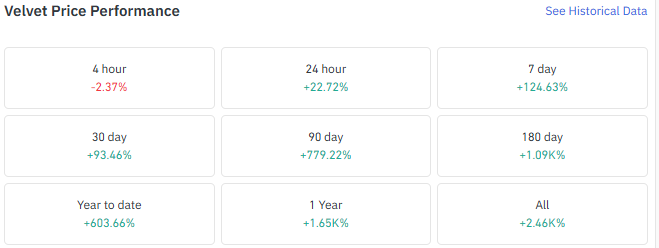
Zooming out, the token is up 22.72% over 24 hours, 124.63% over the past week, 93.46% over 30 days, and a sharp 779.22% over the past 90 days.
Looking further back, VELVET has gained 1.09K% over six months, 603.66% year to date, 1.65K% over the past year, and 2.46K% since inception.
This isn't the first time VELVET has moved sharply within this cycle; an earlier Velvet price prediction jumped 42% as whale wallets held firm on supply, a pattern of concentrated holding that has repeated through this run.
Data source: CionGlass
What We're Watching Next
As per CoinGabbar analysts, the recent move has been a strong one, but whether it sustains largely comes down to continued buyer participation.
If demand keeps stepping in on dips, the $Velvet price prediction picture stays tilted toward further upside from here.
If buying interest fades instead, $VELVET could give back ground toward the levels it spent weeks basing around before this breakout.
For now, the setup favors a wait-and-watch approach around the current zone rather than chasing the move outright.
Disclaimer: This article is for informational purposes only and should not be considered financial or investment advice. Cryptocurrency markets are highly volatile, and prices can move sharply in either direction. Readers should conduct their own research and consult a qualified financial advisor before making any investment decisions.













.webp)








