Venice Token Price Prediction: $VVV $15 Soon, Massive Rally Ahead?


Venice Token is heating up today, and traders are jumping back in fast.
VVV has pushed higher and broken out of the downtrend it was stuck in for days, and the move is grabbing attention across the market. The price is now trading above $12 after the bounce.
This Venice Token Price Prediction breaks down the liquidation and volume data behind the move, who's actually holding VVV, and the levels that could decide what happens next.
Venice Token is a crypto project, according to the project's own materials. Stick around till the end, because this one is moving fast.
Market data checked on August 10, 2026. 17:14 UTC+5:30
Venice Token Price Prediction Today: Market Overview
Metric | Value |
Price | $12.079 |
24h Change | +8.03% |
Market Cap | $577.58M (+8.02%) |
Volume (24h) | $12.5M+ (+201.21%) |
Vol/Mkt Cap (24h) | 2.23% |
FDV | $978.9M |
Liq/Mkt Cap | 2.49% |
Total Supply | 80.75M $VVV |
Max Supply | Uncapped |
Circulating Supply | 47.64M $VVV |
Holders | 140.18K |
Source: Data from CoinMarketCap as of August 10, 2026. 17:14 UTC+5:30. Figures may vary slightly across other tracking websites.
Venice Token Liquidation and Volume Data
Liquidations
Window | Total | Long | Short |
1h | $100.24 | $100.24 | $0 |
4h | $7.63K | $103.42 | $7.53K |
12h | $8.57K | $479.83 | $8.09K |
24h | $20.85K | $612.18 | $20.23K |
Short liquidations lead across every window here, and by a wide margin, which lines up with the price pushing higher and squeezing traders who were positioned for a drop.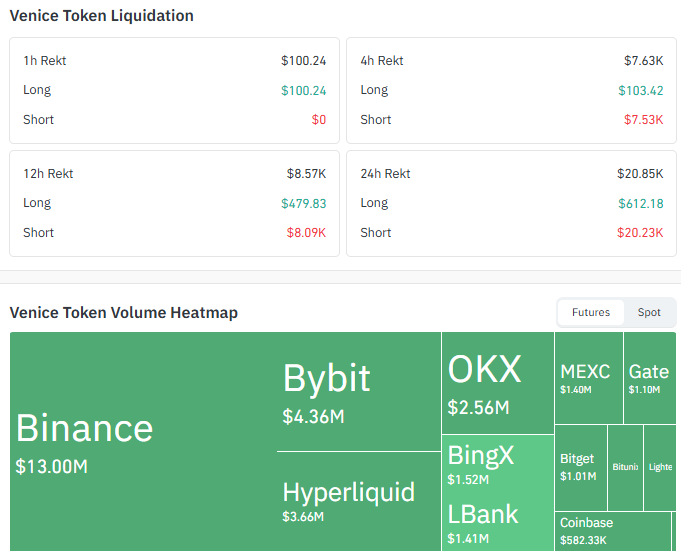
Source: Data From CoinGlass
$VVV Futures Volume by Exchange (24h)
Exchange | Volume |
Binance | $13.00M |
Bybit | $4.36M |
Hyperliquid | $3.66M |
OKX | $2.56M |
Binance carries the largest share of futures activity, with Bybit and Hyperliquid also seeing solid volume behind the move.
Venice Token Holder Data: Who's Holding VVV?
VVV's supply is extremely concentrated. The top 100 holders control 98.13% of the supply, and whales, just 0.05% of holders, hold 97.43% of the market cap. 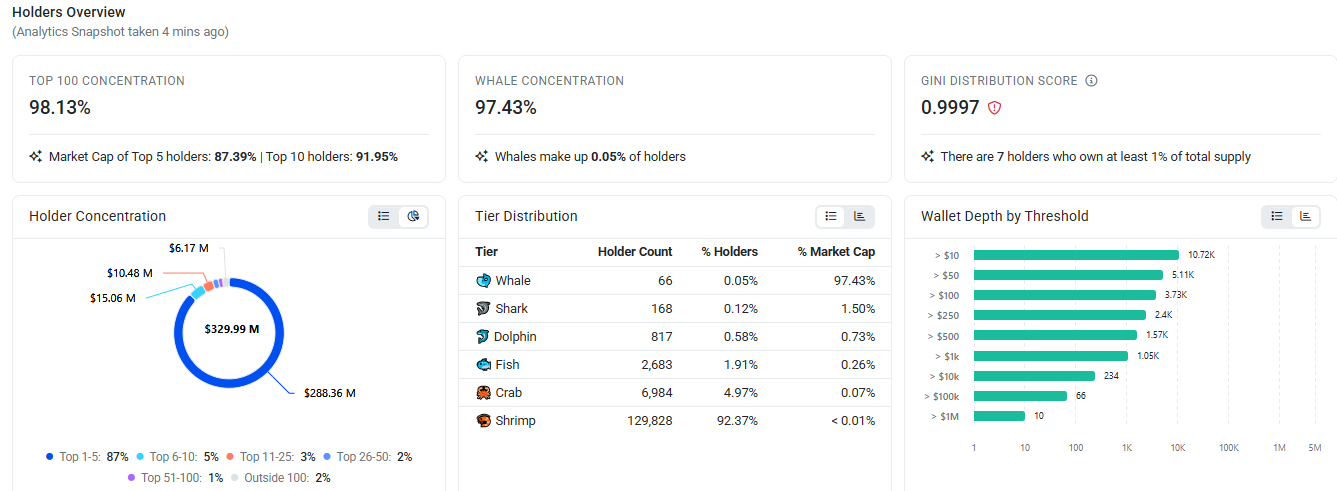
Just 7 wallets each own at least 1% of the total supply.
Tier | Holder Count | % of Holders | % of Market Cap |
Whale | 66 | 0.05% | 97.43% |
Shark | 168 | 0.12% | 1.50% |
Dolphin | 817 | 0.58% | 0.73% |
Fish | 2,683 | 1.91% | 0.26% |
Crab | 6,984 | 4.97% | 0.07% |
Shrimp | 129,828 | 92.37% | <0.01% |
This is one of the more top-heavy holder bases out there, with a very small group of wallets controlling almost the entire supply.
Venice Token Price Prediction Chart: Technical Analysis
Pair: VVV/USDT · Timeframe: 4H · Source: TradingView · Timestamp: August 10, 2026, 17:14 UTC+5:30
VVV is trading at $12.079. The price rallied sharply to a peak near $14.50 in late July, then slid lower inside a falling trendline for over a week.
That trendline has now been broken, with the price pushing back above it on rising momentum. RSI (14) is at 64.36, on the stronger side but still below overbought territory.
The trend stays bullish as long as the price trades above the EMA 20 and EMA 50 near $11.594 to $11.672 and holds the $11.078 support.
If the price trades back below that support and breaks the EMA zone, we can assume a bearish trend until the trend turns bullish again.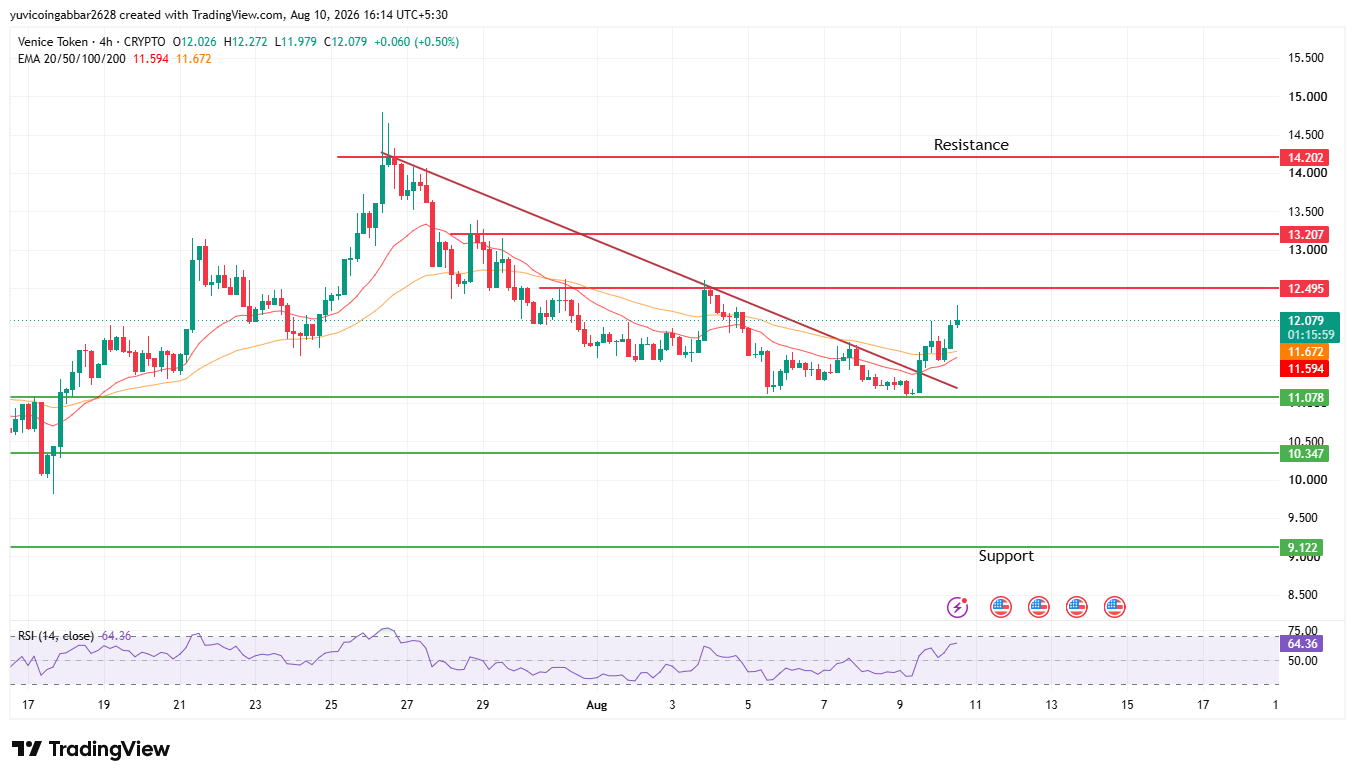
Support and Resistance Levels
Level Type | Price |
Resistance 3 | $14.202 |
Resistance 2 | $13.207 |
Resistance 1 (nearest) | $12.495 |
Immediate Price Reference | $12.079 |
Nearest Support | $11.078 |
Deeper Support | $10.347 |
Structural Floor | $9.122 |
EMA Levels
EMA | Price |
EMA 20 (near support) | $11.594 |
EMA 50 (near support) | $11.672 |
Venice Token Forecast: Bull Case vs. Bear Case
VVV price target 2026 Bull case: Holding above $11.078 and staying above the EMA cluster near $11.594 to $11.672 keeps the trendline breakout intact.
A confirmed move above $12.495 would open the path toward $13.207 and then $14.202.
VVV price target 2026 Bear case: A close back below $11.078 would put the breakout in doubt. Losing the EMA cluster and $10.347 would expose the structural floor at $9.122.
VVV price target: Can VVV reach $14.202?
$14.202 is the highest resistance marked on the chart and lines up with the late-July peak.
Getting there would take a multi-stage move: first clearing $12.495, then $13.207, before the price could realistically test that level again.
What Could Invalidate the Bullish Setup?
A rejection at $12.495 followed by a close back below $11.078 and the EMA cluster would put the breakout in question.
A deeper break below $10.347 and the structural floor at $9.122 would undo the bounce entirely.
Venice Token Price Prediction: Expert View
According to CoinGabbar analysts, The break above the falling trendline is the key development on this chart, and RSI at 64.36 shows real strength behind the move without being stretched into overbought territory.
The liquidation data backs this up, with short liquidations far outweighing longs across every window, which usually means short sellers got caught out as price pushed higher.
Strong futures volume on Binance and Bybit shows genuine participation behind the bounce.
The very high holder concentration is worth keeping in mind too, since a small group of wallets controls almost all of the supply, which can add extra volatility if any of them decide to move.
The $11.078 to $12.495 zone is the range to watch: holding above it keeps the breakout thesis alive, while losing it would suggest the bounce is fading.
Venice Token Price Prediction: Data Sources
Price, market cap, and supply data referenced from a market tracker snapshot.
Holder concentration and tier data referenced from an on-chain holder analytics snapshot.
Liquidation and futures volume data referenced from Coinglass. Price and EMA data referenced from a 4H VVV/USDT chart via TradingView, timestamped August 10, 2026, 17:14 UTC+5:30.
Disclaimer
This piece is for informational purposes only and isn't financial advice. The levels and scenarios above are based on technical chart analysis and publicly available data at the time of writing, and crypto markets can move sharply within hours, so past patterns don't guarantee future outcomes. It's worth doing independent research and considering your own risk tolerance before acting on any of the levels discussed here.

















