XPIN Network Price Prediction: Can XPIN Extend Its 39% Rally?


XPIN Network price prediction talk is spreading fast today, and it's easy to see why. The token just ripped higher in a matter of hours, and traders who weren't watching missed the move entirely. Turns out a quiet DePIN project just became one of the loudest tickers on crypto Twitter.
That kind of jump doesn't happen without a reason, and there's clearly one behind this. Stick around, because the chart, the volume, and the numbers behind this move tell a story worth understanding before you decide what to do next.
Why Is $XPIN Suddenly The Coin Everyone Is Watching Today
XPIN Network price prediction searches spiked the moment the token's daily chart lit up green. Basically, a move this sharp forces even casual traders to pay attention.
We pulled up the chart expecting a normal green day. What we found instead was a full breakout candle that dwarfed the past three months of price action.
Buyers didn't creep in slowly here. And that's exactly the kind of move that gets a token trending before most people even know why.
Is this the start of something bigger, or just another crypto pump that fades by the weekend?
Coin Snapshot: Where $XPIN Stands Right Now
| Field | Detail |
|---|---|
| Coin Name | XPIN Network |
| Ticker Symbol | XPIN |
| Blockchain | BNB Smart Chain (BEP-20) |
| Today High | $0.0022287 |
| Today Low | $0.0016494 |
| RSI Level | 81.72 |
| Token Type | Utility Token |
| Token Category | DePIN (Decentralized Physical Infrastructure) |
| Market Cap | $84.13M |
| 24H Trading Volume | $20.8M |
| 24H Trading Volume Change | +401.09% |
| Circulating Supply | 39.23B XPIN |
| 24H Change | +39.43% |
Source: Data by CoinMarketCap
What XPIN Network Actually Is And Why It Runs On BNB Chain
XPIN Network is a DePIN project, meaning it connects real-world hardware like eSIM devices and connectivity gear to blockchain rewards. It runs on the BNB Smart Chain as a BEP-20 token.
The project ties everyday data and travel eSIM usage to on-chain incentives. That's a real-world use case, not just a chart to speculate on.
Where $XPIN Has Traveled Since Its Launch Last Year
$XPIN hit an all-time high near $0.01004 back in October last year, and it's still down over 78% from that peak even after today's rally.
But here's what most traders are missing. The all-time low sits at $0.0004573, and the price has climbed more than 376% off that bottom already.
Why This DePIN Token Is Not Just Another Hype Cycle Bet
XPIN Network's ecosystem includes eSIM products sold through Binance Pay and cross-platform giveaways run directly through its official account. That's active distribution, not silence.
The project also announced a partnership appearance at a Bitget Wallet event in Tokyo, offering free eSIM access to attendees. Real partnerships like this matter more than a single green candle.

Source: Posted on X by XPIN Network
XPIN Network Liquidation Data Shows Where Traders Got Hurt
| Window | Total Liquidated | Longs Liquidated | Shorts Liquidated |
|---|---|---|---|
| 1H | $73.47K | $34.57K | $38.90K |
| 4H | $445.96K | $175.33K | $270.63K |
| 12H | $1.05M | $404.62K | $641.53K |
| 24H | $1.19M | $472.06K | $714.86K |
Source: Liquidation data by CoinGlass
The 24-hour liquidation total on XPIN crossed $1.19M, with short sellers taking the bigger hit against long liquidations. That imbalance tells its own story: traders betting against XPIN got squeezed hard as the price tore through resistance.
What XPIN Network's Token Supply And Vesting Really Mean
XPIN's total supply sits at 100 billion tokens, released over ten years with output halving every year. Ecosystem incentives alone take up 40% of that supply.
Team and advisor tokens carry a 6-month cliff before a 24-month vesting period. Strategic backers face a similar structure, which limits sudden dump risk in the short term.
Still, whale concentration is extreme. The top 10 wallets hold close to 79.39% of circulating supply, and that's a real risk factor worth watching.
XPIN Network Technical Price Analysis Signals A Breakout In Progress
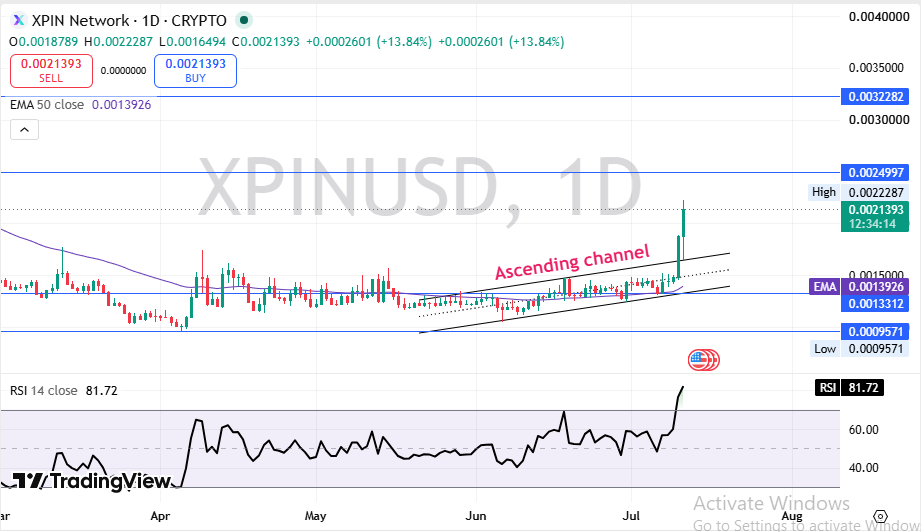
The price is moving fast, and the chart backs that up. In the 1-day timeframe, XPIN broke out of an ascending channel that had been building since April.
Source: Charting by TradingView
The token trades well above its 50 EMA near $0.0013926, and that gap alone tells you buyers are firmly in control right now.
RSI sits at 81.72. That's deep overbought territory, and pullbacks from levels like this aren't rare.
Immediate support sits at $0.0013312. Above this price, resistance stacks up at $0.0024997 first, then $0.0032282 further out.
A confirmed close above $0.0024997 on strong volume opens the door toward that next resistance zone fast. Failure to hold above it could trigger short-term profit taking instead.
The setup stays valid unless the price closes below the invalidation zone at $0.0009571. That would flip the entire structure bearish.
XPIN Network Volume Heatmap Reveals Where The Real Buying Sits
| Exchange | 24H Volume |
|---|---|
| Binance | $149.64M |
| LBank | $35.61M |
| Bybit | $26.73M |
| Bitget | $19.39M |
| BingX | $9.80M |
| Gate | $7.36M |
| Bitunix | $5.82M |
Source: Volume heatmap by CoinGlass
Binance alone processed the bulk of XPIN volume, dwarfing every other exchange combined. Basically, this rally isn't spread thin across obscure exchanges; it's concentrated where liquidity actually lives.
XPIN Network Short-Term Price Prediction: What Could Happen Next Week
The next few days likely decide whether this breakout holds or fades back into the old range.
| Timeframe | Bearish Target | Base Target | Bullish Target | Key Trigger |
|---|---|---|---|---|
| 24 Hours | $0.0018500 | $0.0021393 | $0.0024997 | Volume holding above average |
| 3–7 Days | $0.0015800 | $0.0020000 | $0.0028000 | Clean close above first resistance |
| 2–4 Weeks | $0.0013312 | $0.0022000 | $0.0032282 | Sustained buyer volume on Binance |
Watch volume more than price here. It's the real tell.
XPIN Network Long-Term Price Prediction Through The 2027 Outlook
The bigger picture depends on whether XPIN's eSIM and DePIN use case keeps attracting real users beyond this week's hype.
| Timeframe | Bearish Target | Base Target | Bullish Target | Catalyst Needed |
|---|---|---|---|---|
| 3 Months | $0.0009571 | $0.0018000 | $0.0030000 | New exchange listings and eSIM adoption growth |
| 6 Months | $0.0007000 | $0.0022000 | $0.0045000 | Expanded partnerships beyond Bitget Wallet |
| End of Year | $0.0005000 | $0.0026000 | $0.0060000 | DePIN sector rotation and real hardware sales |
| 2027 Outlook | $0.0004573 | $0.0035000 | $0.0090000 | Sustained ecosystem revenue from device network |
The long-term case leans more speculative than proven right now, and that's worth saying plainly.
Three XPIN Network Price Scenarios Traders Should Prepare For
Worst Case: Momentum fades fast; whales holding 79% of supply start distributing into strength. Price slides back toward the $0.0009571 invalidation zone within weeks.
Base Case: XPIN consolidates between support and first resistance while the market digests this move. Price grinds sideways near $0.0018 to $0.0024 before choosing a direction.
Best Case: Volume keeps climbing across Binance and other top exchanges as eSIM adoption grows. Price clears both resistance zones and pushes toward $0.0032282 and beyond.
| Scenario | Price Range | What Triggers It |
|---|---|---|
| Worst Case | $0.0007000 - $0.0009571 | Whale distribution and fading market momentum. |
| Base Case | $0.0018000 - $0.0024000 | Sideways consolidation after the recent rally. |
| Best Case | $0.0028000 - $0.0032282 | Volume expansion supported by real ecosystem growth. |
Key XPIN Network Price Levels Every Trader Should Watch
Resistance zone: $0.0024997 first, then $0.0032282, both capping further upside for now.
Support zone: $0.0013312 remains the level buyers have defended on pullbacks.
Invalidation zone: $0.0009571 below current price; a close under this breaks the bullish structure entirely.
XPIN Network Analyst View And Final Thoughts On The Rally
When we pulled up XPIN's daily chart, the ascending channel breakout was the first thing that stood out, not the RSI. That structure shift matters more than one green candle.
RSI at 81.72 says this move is stretched. But stretched doesn't always mean done, especially with volume still climbing.
A weekly close above $0.0024997 would confirm buyers can hold this level under real pressure, not just a single day of hype.
Beyond the chart, keep an eye on broader risk appetite. The Crypto Fear and Greed Index gives a quick read on whether traders are chasing or hesitating right now.
Whale concentration remains the biggest structural risk here. Ten wallets controlling nearly 80% of supply can move this market in either direction fast, a risk shared by other concentrated tokens like those flagged in recent whale concentration risk reports.
The most important level to watch stays $0.0013312. Lose that, and the bullish case weakens quickly.
Risk is still real. But for now, buyers are clearly the ones writing the story.
Disclaimer: This article is for educational purposes only and does not constitute financial advice. Crypto markets are volatile. Consult your investment advisor before making any investment decision.
Also read:

















