XRP Price Prediction CPI Week: Can XRP Hold the $1.06 Support?

Updated: July 23, 2026
Change Note: This XRP price prediction CPI week update adds refreshed CPI context, ETF-flow analysis, a transparent bull/base/bear framework, and updated technical levels.
Refresh Cadence: Weekly during major catalyst periods; monthly for evergreen technical sections.
XRP price prediction CPI week is becoming a key search topic as the altcoin trades near $1.06 while US CPI data and the CLARITY Act hearing approach. $XRP is down almost 6% this week, retail sentiment has reached a five-week FOMO high, and whale activity has slowed sharply. This combination of falling price, rising crowd optimism, and major macro and regulatory catalysts is creating an uncertain setup for traders.
The bigger question is whether it can hold its current support or face another move lower. For a broader outlook, traders can also review XRP price prediction 2026 alongside the latest technical signals.
Why Are People Searching XRP Price Predictions?
Traders are searching for $XRP price prediction today because three things are colliding at once.
The altcoin is down almost 6% this week, retail sentiment is showing the most FOMO in five weeks, and two major catalysts, US CPI data and the CLARITY Act hearing, are landing within days of each other. That mix of a dipping price, rising crowd excitement, and looming news events is exactly why traders want to know where $XRP goes next.
What Is the Current Price of XRP Today?
The altcoin is changing hands around $1.06 to $1.07, according to the provided derivatives data. $XRP slipped more than 1% over the past 24 hours and is down almost 6% on the week.
The 24-hour range has remained tight, with a low of $1.05 and a high of $1.08. Trading volume rose 11%, suggesting that both sellers and dip buyers are active.
Metric | Value |
Price | $1.0696 |
24h Change | +0.85% |
Market Cap | $66.81B |
Open Interest | $2.32B |
Circulating Supply | 62.46B |
Total Supply | 99.98B |
Max Supply | 100.00B |
For XRP trading volume, the 11% increase is worth watching because a sustained rise in volume alongside a breakout would provide stronger confirmation than a low-volume move.
Why Are Traders Suddenly Bullish?
Sentiment data from Santiment shows its experiencing a five-week high in FOMO.
There are currently 3.02 bullish comments for every bearish comment on social media. That is the highest ratio among the three major assets compared in the data.
Ethereum sits at 2.31, while Bitcoin is at 1.40, suggesting a more neutral sentiment around BTC.
The catch is that crypto markets can sometimes move against extreme crowd sentiment. When traders become highly optimistic while price is still falling, it can signal a short-term pullback rather than an immediate rally.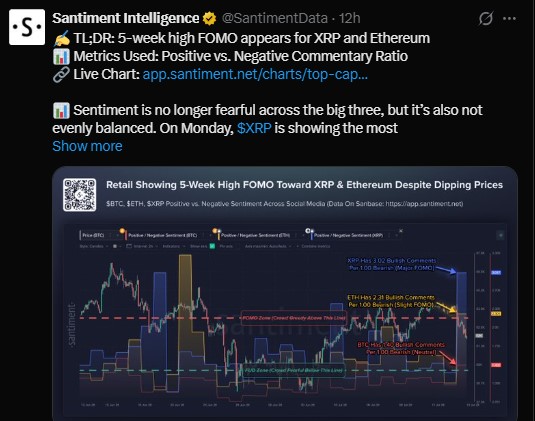
$XRP News Today: Is Whale Activity Slowing?
Yes, and this matters. Large XRP transactions worth more than $1 million reportedly dropped from 70 transactions to just two in one week.
This decline coincides with heavy US spot ETF outflows and broader uncertainty surrounding the US-Iran conflict. The data suggests that larger market participants may be taking a more cautious approach.
This does not automatically mean whales are bearish. It may simply indicate that larger holders are waiting for clearer macro or regulatory signals before increasing exposure.
What Does the $XRP Derivatives Market Show?
CoinGlass data paints a mixed picture. Total futures open interest rose 1.30% to $2.33 billion over the last day, while CME futures open interest fell almost 2.65%.
Other derivatives data adds more context:
Derivatives Data | Value |
Long/Short Ratio (24h) | 0.9619 |
Binance Long/Short Accounts | 2.6576 |
OKX Long/Short Accounts | 2.96 |
Options Volume | +103.08% ($1.97M) |
24h Long Liquidations | $3.51M |
24h Short Liquidations | $195.05K |
Long positions are being liquidated far more heavily than shorts, matching the recent price weakness.
The technical model used in this outlook combines RSI, moving averages, trading volume, derivatives positioning, and key support and resistance levels. RSI helps measure momentum, moving averages identify trend direction, volume confirms breakouts, while derivatives data shows how traders are positioned. These indicators do not guarantee a target but help establish the probability of each scenario.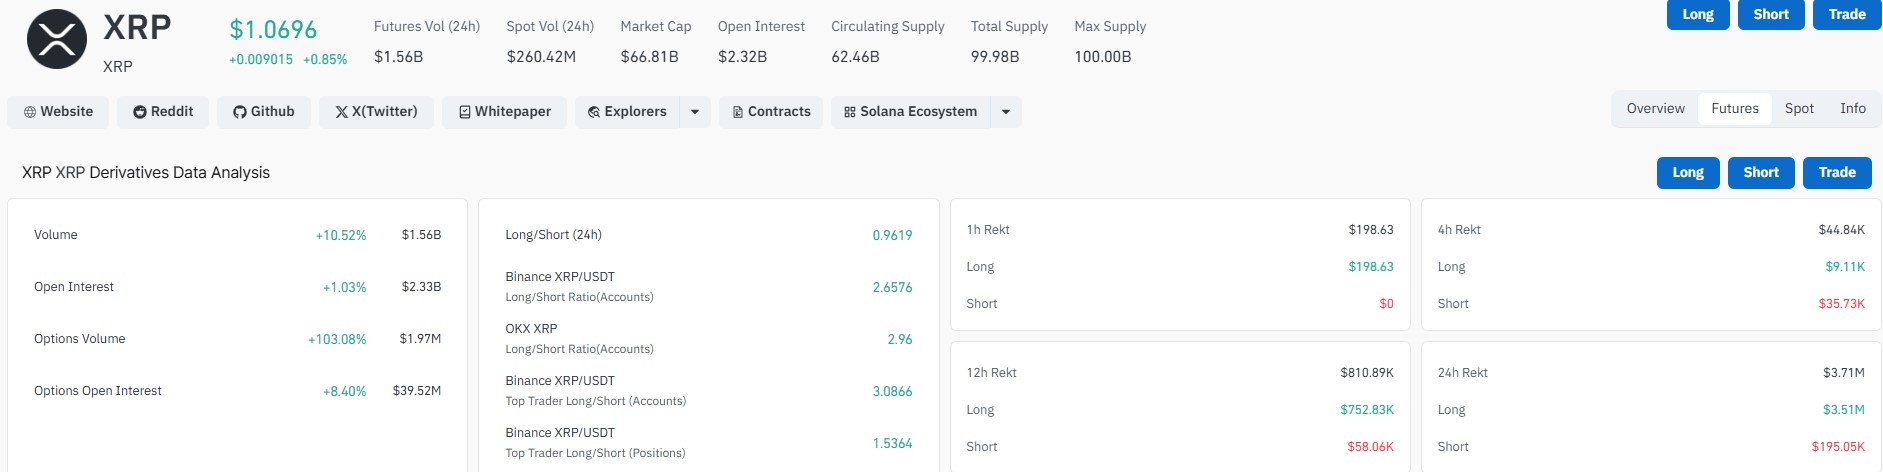
How Could US CPI Data Affect $XRP Price?
All eyes are on the US CPI inflation report. The forecast in the source data expects inflation at 3.9%, down from 4.2% previously.
CPI Scenario | Potential Reaction |
Cooler than expected | Could support risk assets and XRP |
Near expectations | Likely keeps XRP range-bound |
Hotter than expected | Could increase selling pressure |
Analyst Crypto Rover warned that a hotter-than-expected inflation reading could trigger a broader market decline.
A cooler CPI print could reduce pressure on risk assets like $XRP, while a hotter number could strengthen concerns about interest rates and push crypto prices lower.
Once the actual CPI number is available, this section should be updated with the expected figure, actual print, and $XRP's price reaction after one hour and 24 hours.
What Does XRP's Chart Pattern Suggest?
Chart analyst EGRAG Crypto has been tracking a long-term diamond pattern on the weekly chart.
According to the analysis, $XRP is entering the bottom window of the pattern. The chart tracks the 50 EMA and 88 SMA, alongside bullish and bearish crosses observed since 2019.
The pattern suggests a potential bottoming phase near current levels, although confirmation requires stronger price action.
For traders reviewing XRP support and resistance levels, the immediate range remains important. It is holding just above $1.05 support, while $1.08 acts as short-term resistance.
A decisive move above $1.08 could improve momentum, while losing $1.05 could expose recent lows.
Could the CLARITY Act Crypto Impact $XRP Price?
The CLARITY Act crypto impact could become increasingly important for $XRP if the legislation advances toward clearer digital-asset rules in the US.
The House Financial Services Committee is scheduled to hold a field hearing on the Crypto CLARITY Act on July 17, 2026, in New York.
The House previously passed H.R. 3633 in July 2025 with a bipartisan 294-134 vote. A revised version was proposed in the Senate Banking Committee on May 14, 2026.
Senators returned from recess on July 13, potentially restarting negotiations. However, no official Senate floor vote date has been confirmed in the source data.
Clearer regulation could support its sentiment over the medium term, but the market should not price in a final outcome before legislation actually advances.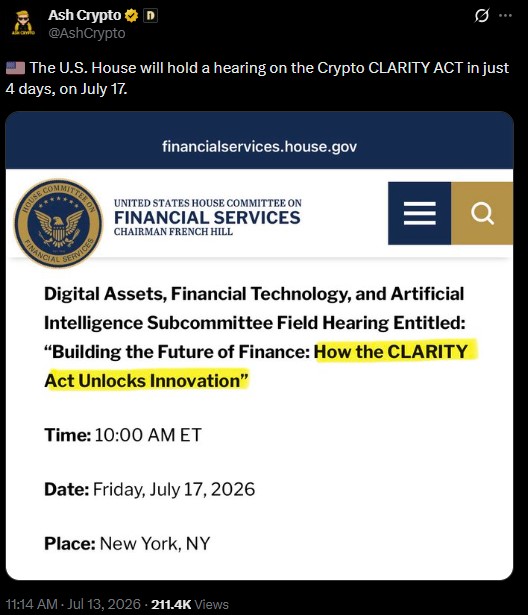
XRP ETF Flows: The Institutional Demand Signal
ETF flows remain one of the most important narratives for the price outlook. The provided data points to heavy outflows, which could temporarily weaken institutional demand.
Combined with slowing whale activity, ETF outflows create a cautious near-term backdrop.
However, a single period of outflows does not necessarily invalidate the longer-term thesis. Traders should monitor whether outflows continue or reverse as CPI and regulatory catalysts pass.
XRP Price Prediction: Bull, Base, and Bear Cases
Scenario | Target | Probability | Invalidation |
Bull Case | $1.15–$1.30 | 25% | Break below $1.05 |
Base Case | $1.00–$1.15 | 50% | Sustained close below $1.00 |
Bear Case | $0.85–$0.95 | 25% | Strong reclaim above $1.15 |
The base case currently carries the highest probability because XRP remains trapped between nearby support and resistance while CPI, ETF flows, and regulatory developments remain unresolved.
Named forecasts also show how wide the potential outcomes can be. Standard Chartered has previously discussed a roughly $2.80 base case, while EGRAG's longer-term cycle view has pointed toward significantly higher levels. These should be treated as separate analyst scenarios rather than guaranteed targets.
XRP Price Prediction: What Could Happen Next?
The XRP price prediction this week largely depends on whether $1.05 support survives the upcoming catalysts.
The bullish scenario requires a cooler CPI print, improving ETF flows, easing FOMO, and progress on regulatory clarity. In that case, XRP could attempt to reclaim $1.08 and establish a higher short-term range.
The bearish scenario would involve hotter inflation, continued ETF outflows, further whale inactivity, and increased liquidations. A break below $1.05 could put recent lows back into focus.
For anyone asking will XRP go up tomorrow, the answer depends heavily on the next macro catalyst rather than the chart alone. Traders asking is XRP a good buy right now should also consider their risk tolerance and time horizon.
At present, the most important question is whether $XRP is bullish or bearish. The answer is mixed: sentiment is bullish, but price action and derivatives positioning remain cautious.
For the broader outlook, readers can compare this setup with $XRP price prediction 2026 and monitor the evolving XRP support and resistance levels as new data arrives.
Bottom Line
XRP is entering a critical catalyst window with CPI data, the CLARITY Act, ETF flows, whale activity, and derivatives positioning all influencing sentiment.
The immediate technical range is $1.05 support to $1.08 resistance. A confirmed breakout above resistance with stronger volume could improve the outlook, while a loss of support would increase downside risk.
For now, the market remains highly sensitive to macroeconomic data and regulatory developments. The next major move is likely to depend less on social-media FOMO and more on whether real institutional demand and buying volume return.
Disclaimer
This article is for informational purposes only and does not constitute financial advice. Cryptocurrency markets are highly volatile and involve significant risk. Prices can rise or fall quickly, and past performance does not guarantee future results. Always conduct your own research and consult a licensed financial advisor before making any investment decisions.

















