XRP Price Prediction: Bullish Setup Emerges Amid Clarity Act Delay


Updated: July 24, 2026
Change Note: This update adds a deeper analysis of the CLARITY Act delay $XRP setup, refreshed technical levels, ETF-flow context, legislative scenarios, analyst targets, and bull/base/bear price scenarios.
Refresh Cadence: Weekly during major $XRP and regulatory developments; monthly for evergreen technical sections.
This CLARITY Act delay XRP analysis looks at whether $1.13 marks a turning point after months of decline. A new chart pattern is giving bulls something to talk about, even as US regulation drags on. For traders searching for an XRP price prediction today, the key question is whether the current technical setup can overcome regulatory uncertainty and push it toward higher resistance levels.
The altcoin is showing early signs of a potential reversal, but the broader trend has not fully changed yet. RSI momentum is improving, ETF inflows remain a supporting factor, and traders are watching the $1.13 area closely.
What Is the Current Price of $XRP Today?
The altcoin was changing hands around $1.1365 on the daily chart, up about 3.43% in the past 24 hours. Futures volume over the last day sat at $2.11 billion, while spot volume was closer to $467 million.
Open interest stood at $2.52 billion, up nearly 4% on the day. That tells us more traders are opening new positions rather than closing old ones, which usually means volatility could pick up soon.
Long and short data on Binance showed a long/short ratio of 2.77, meaning more accounts are betting on a bounce than a drop. OKX numbers looked similar, with a ratio of 2.6.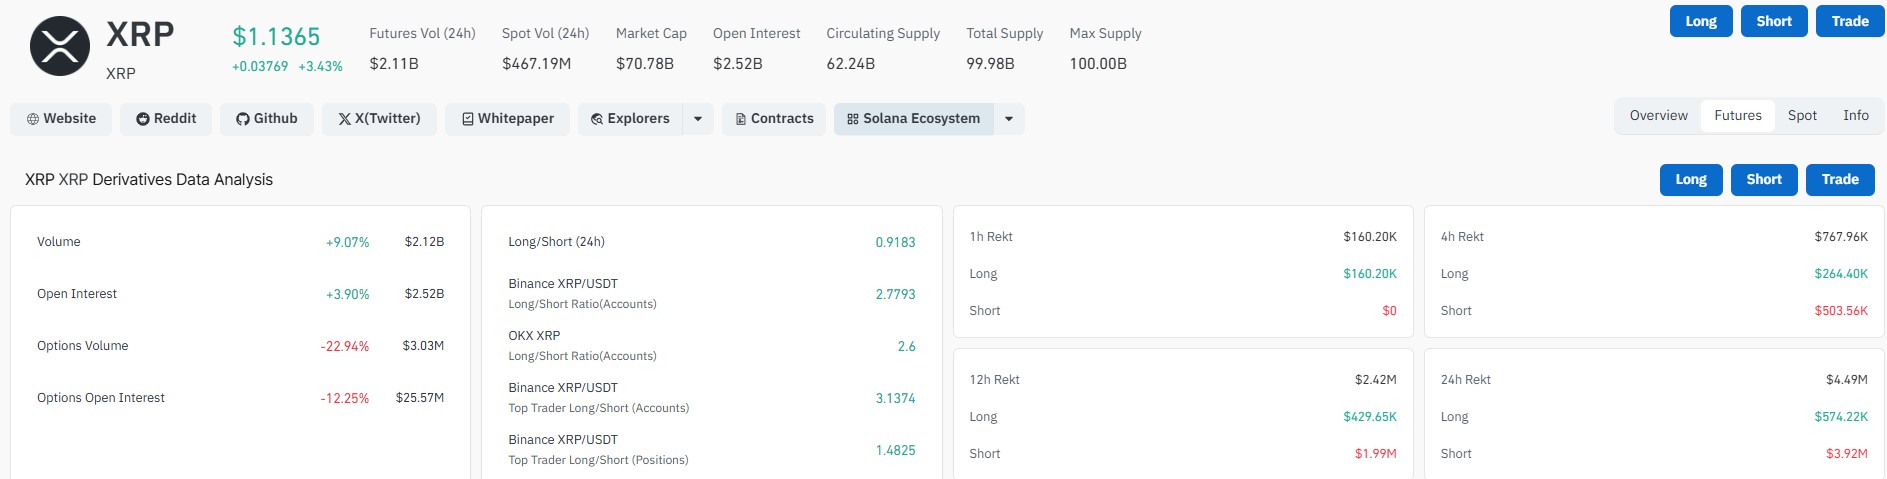
The derivatives picture is therefore leaning bullish, but traders should be careful. Rising open interest alongside a price increase can support a breakout, but it can also increase liquidation risk if the move fails.
For anyone following trading volume, the key signal is whether spot activity begins rising alongside futures activity. A spot-led rally would generally provide stronger confirmation than a move driven mainly by leveraged positions.
Is $XRP Forming a Bullish Reversal Pattern?
The daily chart shows the altcoin still stuck inside a falling channel that started back in mid-2026, after price topped out near $3.66. Each lower high has stayed under the descending trendline.
But there's a wrinkle. As per the tweet, on the 3-day chart, a five-wave decline appears to be wrapping up. Price made a lower low near the fifth wave, yet the RSI printed a higher low at the same time.
This mismatch — price falling while momentum rises — is known as hidden bullish divergence. It often shows up before a trend shift, though it does not guarantee one.
Chart annotations point to a possible move toward the $1.88 zone if the coin can clear the current supply zone, sometimes called the "cloud" on the chart. That would mark a retest of the 161.8% Fibonacci extension level.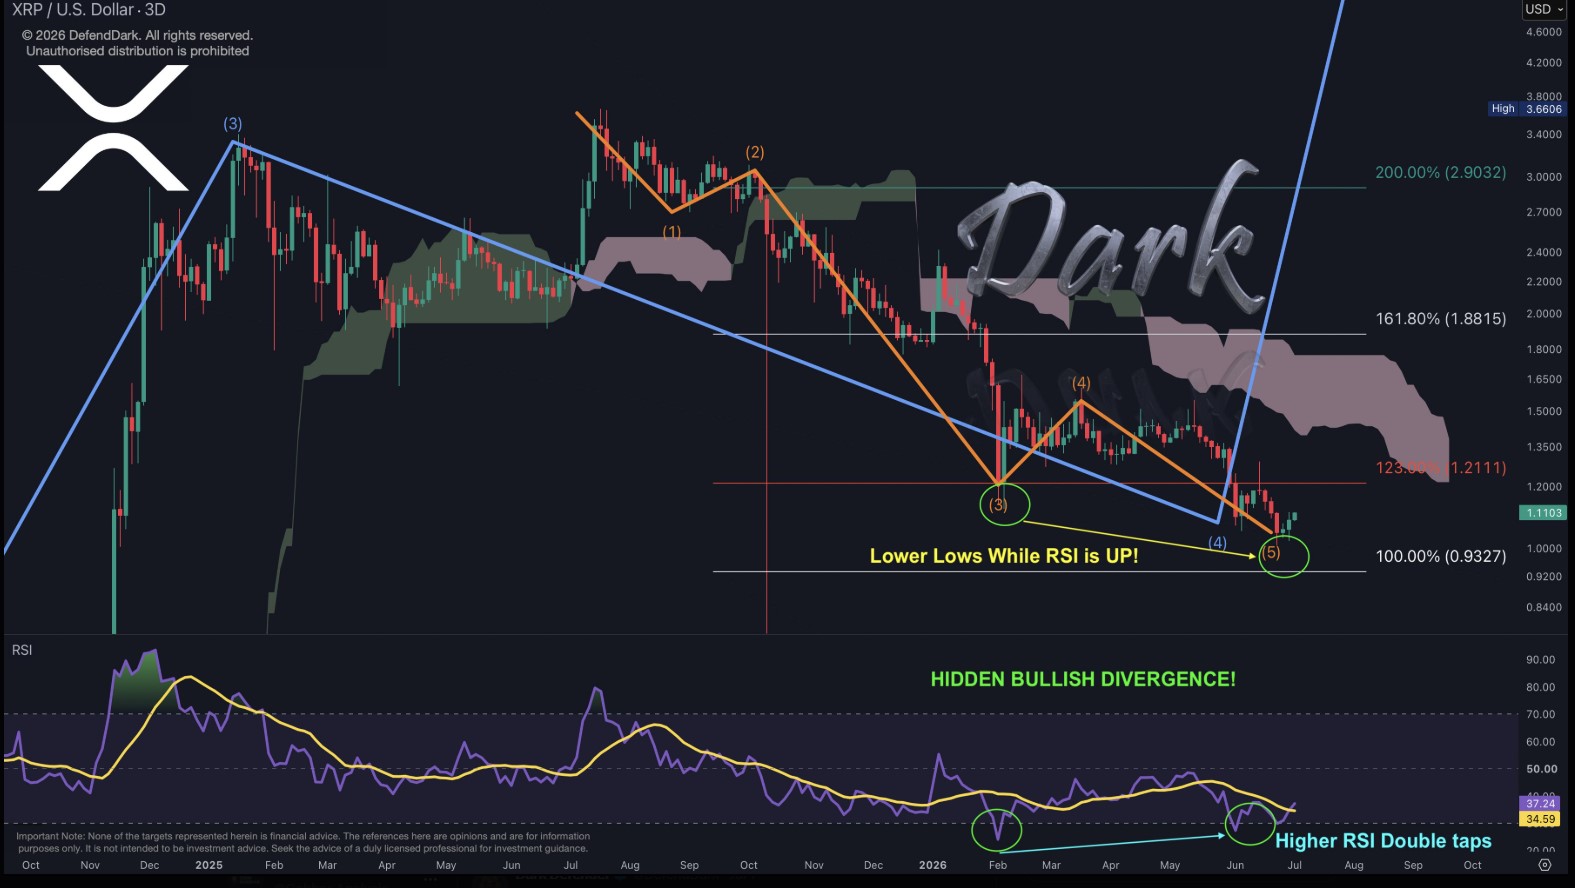
This is where the current $XRP RSI and Fibonacci levels become important. If RSI continues improving while it reclaims key moving averages, the reversal setup could become more convincing.
However, the falling channel remains a major obstacle. Until it breaks the descending trendline and holds above it, the current setup should be treated as a potential reversal rather than a confirmed trend change.
What Does the $XRP Technical Analysis Show?
The current analysis today points to a market at an important technical decision point.
The primary support area sits between $1.00 and $1.13. On the upside, $1.40 is the first major resistance, followed by $1.88.
The technical model used in this analysis focuses on four major indicators:
-
RSI: Used to identify momentum shifts and potential bullish divergence.
-
EMA and moving averages: Used to determine whether it is still in a broader downtrend.
-
MVRV: Used as a supplementary valuation indicator to understand unrealized market gains and losses.
-
Volume: Used to confirm whether price breakouts have genuine buying participation.
The model also considers ETF flows and regulatory developments as external catalysts.
A bullish scenario becomes stronger if it holds $1.13, RSI continues improving, trading volume expands, and price reclaims the $1.40 resistance. A bearish scenario becomes more likely if it loses $1.00 on strong selling volume.
How Is the CLARITY Act Delay Affecting XRP?
The CLARITY Act delay $XRP narrative has become an important part of the market outlook.
The Major County Sheriffs of America recently shifted its stance on the Clarity Act to "neutral." The group cited ongoing talks over Section 604, part of the Blockchain Regulatory Certainty Act.
In a letter to Senate Banking leaders, the group said there's still room to improve the bill for state and local law enforcement needs. This kind of back-and-forth can slow down the bill's timeline in Congress.
Regulatory clarity has been a recurring theme for price action. Delays or amendments to crypto market structure bills can keep short-term volatility elevated.
For investors researching the broader CLARITY Act crypto impact, the key issue is whether the legislation eventually provides clearer rules for digital assets and market participants.
CLARITY Act Timeline and Potential $XRP Impact
| Legislative Scenario | Potential Impact | Market Reaction |
|---|---|---|
| Bill advances toward passage | Positive | Regulatory optimism could support XRP |
| Further delays | Neutral to negative | It may remain range-bound |
| Major amendments | Uncertain | Volatility could increase |
| Bill fails or stalls indefinitely | Negative | Regulatory premium could fade |
The exact legislative calendar remains subject to congressional negotiations and procedural changes, so traders should avoid treating any projected date as guaranteed.
How Are XRP ETF Inflows Affecting Price?
According to SoSoValue data, XRP ETFs saw $6.55 million in net inflows in a single recent session. Steady ETF demand can add buying pressure over time, although daily inflows alone rarely move price sharply on their own.
The latest weekly ETF net-flow figure available in the source material is the $6.55 million recent-session inflow. This should be viewed alongside cumulative flows rather than as a standalone signal.
The broader interpretation is straightforward:
-
Sustained ETF inflows + rising XRP price = stronger bullish confirmation
-
Sustained ETF inflows + falling XRP price = possible accumulation
-
ETF outflows + falling XRP price = bearish confirmation
-
ETF outflows + rising XRP price = potential warning signal
ETF demand is therefore becoming an important part of the forecast, particularly if institutional flows continue to strengthen.
What Is the Long-Term $XRP Price Target?
Longer-term weekly charts going back to 2015 show the altcoin hovering inside a wide rising channel. Some chart watchers have marked possible extension targets near $3.27, $8.17, and even $17.16 if the multi-year pattern plays out.
These are chart-based projections, not guarantees. The altcoin would need to break well above recent highs and sustain momentum for months to reach those zones.
Other analysts have presented different targets. Standard Chartered has previously discussed a roughly $2.80 base-case target, while EGRAG Crypto has discussed a broader $7–$10 cycle view. The higher $17.16 projection from the chart represents a more aggressive technical scenario.
This comparison shows why investors should not rely on a single price target.
What Are the Key $XRP Support and Resistance Levels?
-
Support: $1.00 to $1.13
-
Resistance: $1.40, then $1.88
-
RSI (14-day): 51.46, near neutral territory
The $1.13 area is currently the most important pivot. Holding it could allow bulls to challenge $1.40. A successful breakout above $1.40 could open the path toward $1.88.
However, losing $1.00 would weaken the reversal thesis and could send XRP back toward prior lows.
Traders looking for detailed XRP support and resistance levels should therefore watch these zones alongside XRP RSI, moving averages, Fibonacci levels, and trading volume.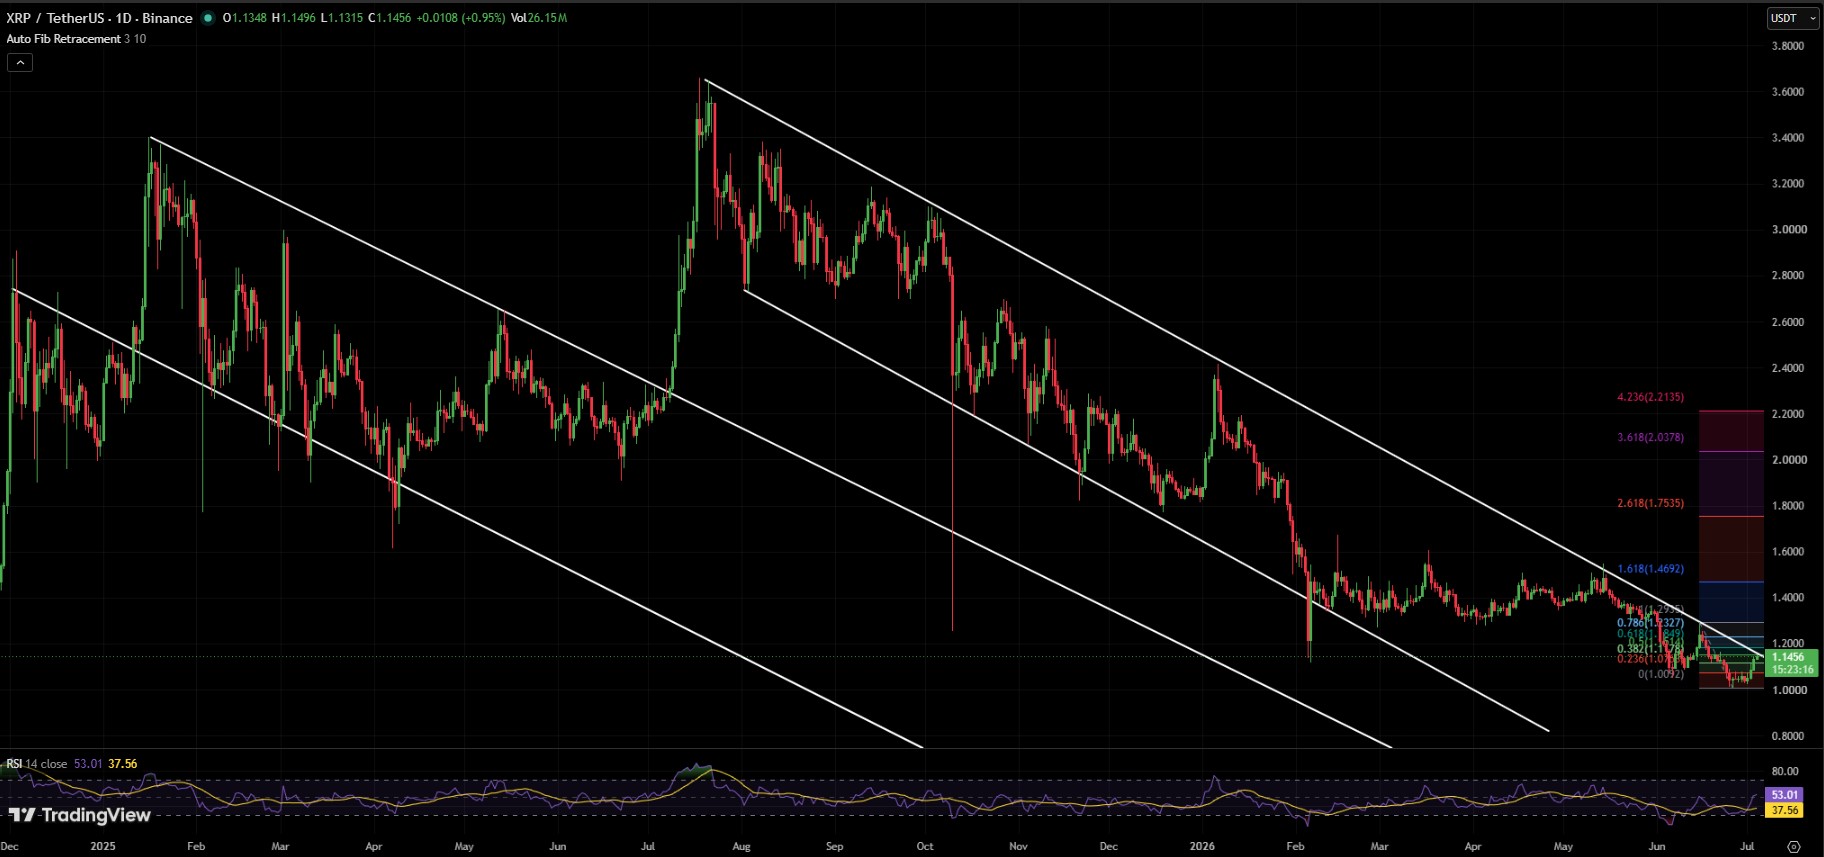
XRP Bull Case, Base Case, and Bear Case
| Scenario | Potential Target | Probability | Invalidation Level |
|---|---|---|---|
| Bull Case | $1.88–$3.27 | 30% | Sustained break below $1.00 |
| Base Case | $1.00–$1.40 | 50% | Strong weekly close below $1.00 |
| Bear Case | $0.76–$1.00 | 20% | Reclaim of $1.40 with strong volume |
These probabilities are analytical estimates rather than statistical forecasts. The model assumes the bull case requires improving RSI, stronger spot volume, healthier EMA structure, and supportive ETF flows.
XRP Price Prediction This Week: Will XRP Go Up Tomorrow?
For anyone searching XRP price prediction this week, the $1.13 and $1.40 levels are likely to matter more than distant targets.
A strong hold above $1.13 followed by a move through $1.40 could signal that buyers are gaining control.
That could lead traders to ask will it go up tomorrow. The answer depends largely on short-term volume, derivatives positioning, and whether the broader crypto market remains supportive.
On the other hand, a rejection from $1.40 could keep it inside its current range.
The question is XRP a good buy right now ultimately depends on individual risk tolerance. $XRP remains volatile, and the bullish reversal has not yet been fully confirmed.
Is $XRP Bullish or Bearish Right Now?
The answer is mixed.
The potential bullish divergence, improving RSI structure, recent ETF inflows, and long-term rising channel are positive factors.
However, It remains below important resistance, the falling channel has not been decisively broken, and the CLARITY Act delay XRP situation continues to create regulatory uncertainty.
Therefore, It can currently be described as neutral-to-bullish above $1.13, but still vulnerable to bearish pressure below $1.00.
Final Thoughts: Can $XRP Break Out?
This XRP price prediction 2026 setup comes down to whether bulls can turn the $1.13 area into a reliable base and eventually flip $1.40 into support.
The potential bullish reversal pattern gives traders a reason to watch the chart closely, but the CLARITY Act delay it narrative remains an important risk factor.
ETF flows, RSI, EMA structure, MVRV, Fibonacci levels, and trading volume will all help determine whether the current setup develops into a sustained rally or another failed recovery.
For now, $1.13 remains the key pivot. Above it, the path toward $1.40 and potentially $1.88 stays open. Below $1.00, the bearish scenario becomes increasingly relevant.
The broader $XRP forecast therefore remains cautiously optimistic but unconfirmed. Traders should watch the technical structure and regulatory developments together rather than relying on a single catalyst or price target.
For readers following the broader XRP price prediction 2026, the current setup can be viewed as an important technical checkpoint rather than a guaranteed bottom.
Disclaimer
This article is for informational purposes only and does not constitute financial, investment, or trading advice. Cryptocurrency markets are highly volatile and carry significant risk. Price targets and scenario probabilities are analytical estimates, not guarantees. Always conduct your own research and consult a licensed financial advisor before making investment decisions.







.webp)








