Quant Price Prediction: What Could Drive QNT Higher or Lower?


As of 11:30 UTC on September 27, 2026, Quant price prediction: QNT trades near $164, up close to 58% over 24 hours after breaking out of a long, quiet range. The near-term trend reads bullish, immediate support sits close to $98, and immediate resistance is the recent high near $194.
The next scenario-based target sits near $279; a slide under $98 would invalidate the setup. A recent Quant price outlook breaks down how that breakout formed. Long-dated numbers below are scenarios, not promises.
Quant Price Prediction: Quick Overview
Metric | Current Reading |
QNT Price | ~$164 (11:30 UTC, Sep 27, 2026) |
24H Change | +58% |
Market Cap | ~$1.99B |
24H Volume | ~$530M |
Trend | Bullish |
Immediate Support | ~$98.43 |
Immediate Resistance | ~$193-194 |
RSI (14, daily) | 92.6, overbought |
Next Target | ~$279 |
Invalidation | Close below ~$98 |
Turns out, a token can jump tens of percent between two daily prints without one headline explaining it.
What Is Quant (QNT)?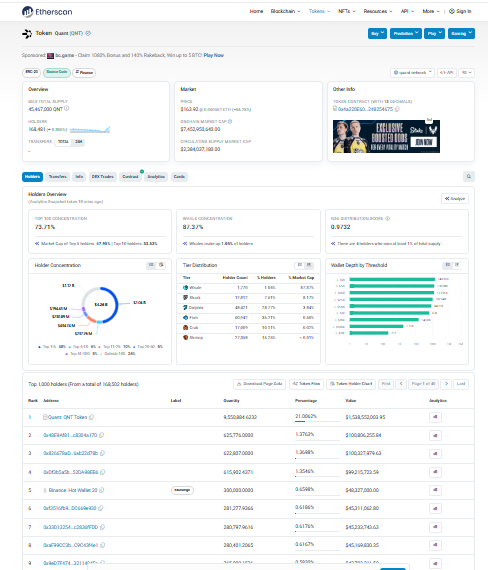
Quant is a blockchain interoperability project. Its core product, Overledger, connects separate blockchain networks so data and value move between them without a custom bridge for every pair, aimed at enterprises over retail trading.
The QNT token gates access to Overledger. Total supply sits near 14.88 million tokens, with roughly 12.07 million circulating, visible on the token's on-chain record.
QNT Current Price and Market Data
Trackers show QNT between $162 and $165, a normal spread during fast moves. Market cap sits near $1.99 billion, and volume runs near $530 million, per the latest market data. Seven-day gains reportedly top 150%, a stretch that rarely holds in a straight line.
QNT Technical Analysis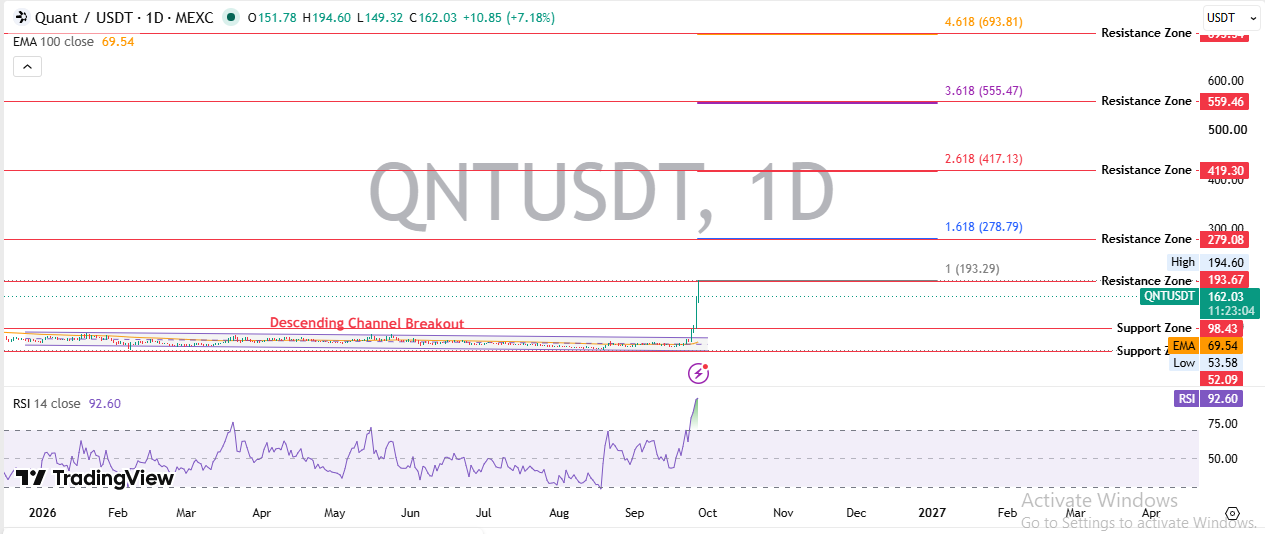
Daily Trend
The daily chart shows a clean breakout from a descending channel that held for months. Price cleared prior swing highs on expanding volume, and the 100-period EMA near $70 sits far below trading levels, confirming trend extension rather than a quick spike. A daily QNT chart shows the channel line clearly.
RSI Analysis
When we pulled up the daily RSI, a reading near 92.6 stood out, deep overbought territory well past the usual 70 threshold. No bearish divergence shows up yet. But readings this stretched rarely hold for long. How long can momentum like that actually last?
MACD Analysis
The MACD line sits at 16.28, above a signal near 6.34, with a histogram near 9.94 and rising. That's accelerating momentum, not a rollover.
Volume Analysis
Breakout plus rising volume confirms strength; breakout plus fading volume warns of a trap. Here, 24-hour volume near $530 million against a roughly $1.99 billion cap is a heavy turnover ratio, real participation rather than thin order books. Fresh exchange coverage, tracked on the exchange listing page, often lines up with spikes like this one.
QNT Support and Resistance Levels
Key Support Zones
The first support zone sits near $98.43, former resistance that flipped once price broke above it. Losing it on a daily close opens the room toward $52-53, the prior range low.
Key Resistance Zones
Immediate resistance sits at the recent high near $193-194. Beyond that, Fibonacci extension levels cluster near $279, $419, and $559, with a stretch target near $694. Positioning data on derivatives platforms shows real money already sitting around several of these zones.
Quant Price Prediction 2026
Scenario | Price Range | What Could Drive It |
Bear | $50-$95 | Loss of $98 support, weak broader market |
Base | $100-$190 | Range holds, gradual recovery |
Bull | $200-$420+ | Breakout holds, volume, fresh catalysts |
Numbers past 2026 depend more on enterprise adoption and crypto liquidity than on any chart pattern. Treat outer years as directional scenarios, tracked alongside broader crypto price forecasts, not fixed targets.
What Could Drive QNT Higher?
More enterprise integrations on Overledger would add real usage behind the token. And cross-chain settlement demand keeps growing as new blockchains launch, which plays to Quant's pitch directly.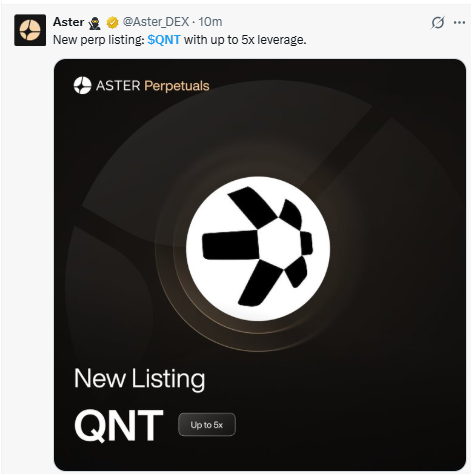
A new perpetuals listing, like the one Aster launched offering up to five times leverage, pulls in trading flow within hours.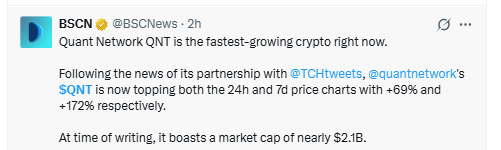
Reports of fresh partnership coincided with this run, and catalysts like that get tracked on the coin events calendar. Bitcoin sat near $85,000, up only about 1% in this same window, so QNT's move looks driven by its own news, not a market-wide push.
What Could Push QNT Lower?
A Bitcoin downturn would drag most altcoins with it. Losing the $98 support zone on a daily close would be the clearest technical warning. Weak follow-through volume, fresh competitors, and regulatory shifts around enterprise blockchain tooling all remain open risks nobody fully controls.
Retail attention rotates fast, too, toward airdrop hunting, tracked on the airdrop calendar, toward meme-token speculation, covered in meme coin news, or toward the next AI-token narrative, followed in AI token coverage.
Trader Takeaway
Bullish confirmation holds above $193 with volume behind it, first target near $279, second target near $419. Bearish confirmation triggers on a daily close below $98, with a downside target near $52. Patience matters here.
Disclaimer
This article is informational only and is not financial advice. Cryptocurrency markets are highly volatile, and prices can reverse sharply within short periods. Data reflects trading activity as of the stated UTC timestamp and can change quickly. Independent research and professional consultation are advised before any investment decision.

















