Solana Price Prediction 2026: Can the Rally Reach $200?

Solana (SOL) trades near $123.90 as of 11:50 UTC on September 27, 2026, up roughly 2.65% on the day. This solana price prediction stays bullish after an ascending channel breakout confirmed in September. Immediate resistance sits at $127.29, and the nearest support holds near $96.55. A daily trade above $145.73 with rising volume opens the next bullish leg. A break below $96.55 flips the setup bearish fast.
Anyone tracking the broader crypto price prediction landscape will notice Solana's chart looks stronger than most large-cap peers right now. But strength on a chart never guarantees direction. Momentum readings and exchange flows tell a more layered story, and that's where this breakdown starts.
Solana Price Prediction at a Glance
Current SOL Price
Data snapshot, pulled from TradingView and CoinMarketCap at 11:50 UTC, September 27, 2026:
Price: $123.90
24H change: +2.65% to +2.82%
Market cap: $72.82 billion
24H volume: $3.13 billion (spot)
7-day change: +11.47%
RSI (14, daily): 70.21
Trend: Bullish, inside an ascending channel breakout
That RSI reading matters. It sits just inside overbought territory, a zone where rallies often pause before continuing.
SOL Short-Term Outlook
The 24-hour range has held between $120.11 and $124.89. A 7-day target near $135 looks reasonable if resistance at $127.29 gives way. A 30-day target stretches toward $160, matching the 1.618 Fibonacci extension zone. Broader sentiment tracked in this latest crypto market news roundup leans risk-on for now, though none of this plays out without volume confirmation.
Solana Price Prediction Table
Timeframe | Bear Case | Base Case | Bull Case | Invalidation |
7 Days | $112 | $128 | $145 | Daily close below $115 |
30 Days | $96 | $150 | $176 | Daily close below $96.55 |
Early 2027 | $85 | $210 | $300 | Weekly close below $80 |
Solana Technical Analysis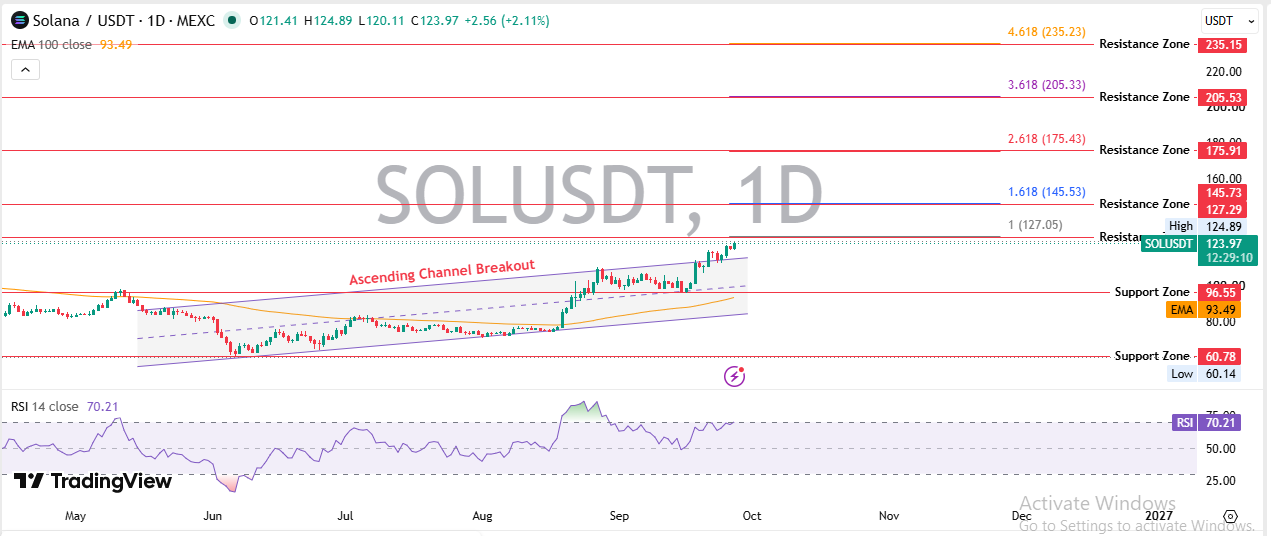
SOL Trend Analysis
Solana has printed higher highs and higher lows since May 2026, forming a clean ascending channel. It broke above that channel in September, a sign buyers took control. The 100-day EMA sits near $93.49, well below trading levels, and the gap keeps widening.
Solana Support Levels
First support runs from $96.55 to $80.00. Holding it keeps the breakout valid. A deeper band sits between $60.78 and $60.14, matching the channel's old lower trendline.
Solana Resistance Levels
Resistance stacks at $127.29, then $145.73, then $175.91, each tied to Fibonacci extensions. Clearing $145.73 needs a real daily trade with strong volume, not just a wick through it.
RSI and Momentum
RSI at 70.21 doesn't confirm a top on its own; strong uptrends can stay elevated for weeks. It brushed 75 in early September, cooled, then climbed again, a pattern that usually favors continuation. A failed new RSI high alongside a new price high would flip that read.
Trading Volume Analysis
Spot volume sits at $3.13 billion against a $72.82 billion market cap, a solid ratio. Futures volume runs near $7.00 billion, showing leverage stacked on spot demand. That raises liquidation risk if a sharp pullback hits.
$SOL Breakout and Breakdown Scenarios
Bullish Breakout Scenario
A daily trade above $127.29, paired with volume above the 20-day average, opens the door toward $145.73. Clearing that level with conviction sets up a run toward $175.91. The scenario fails if the price closes back below $124 within 48 hours of the initial break, a classic false breakout tell.
Bearish Breakdown Scenario
A failure to hold $96.55 sends the price toward the $80.00 zone next. Losing that level too puts the $60.78 to $60.14 band back in play, erasing most of the year's structural progress. This scenario invalidates on any daily reclaim of $96.55 with volume.
What Could Drive Solana Higher?
ETF and Institutional Demand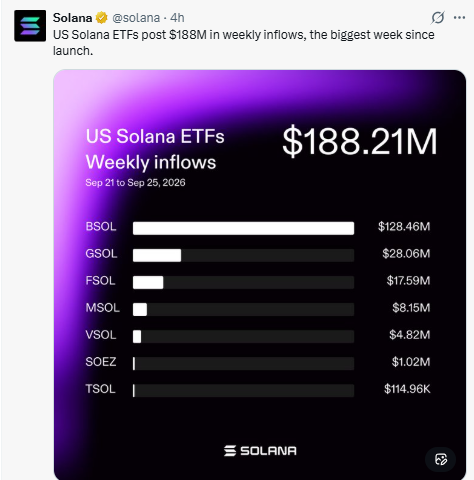
US Solana ETFs posted $188.21 million in weekly inflows between September 21 and 25, 2026, the largest week since launch, led by BSOL at $128.46 million. Cumulative net inflow across the US SOL Spot ETF category has reached $1.61 billion, now representing 2.75% of Solana's market cap. That's real, sustained demand, not a one-day spike.
SOL Network Upgrades
Faster transaction processing through mechanisms like the Gulf Stream protocol keeps Solana competitive on throughput. Continued upgrades reduce downtime risk, a historical concern for the network.
DeFi and Stablecoin Activity
Stablecoin settlement volume on $SOL has grown steadily through 2026. More stablecoin activity generally means more transaction fees burned and more organic demand for SOL as gas.
On-Chain Adoption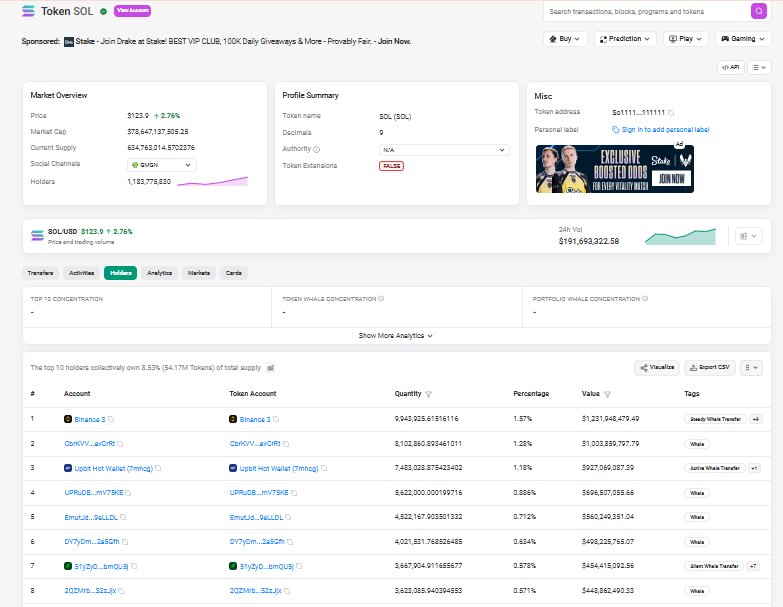
The holder count on Solana now tops 1.18 million addresses. The top 10 wallets control 8.53% of total supply, a concentration level worth watching but not alarming for a network this size. Growth inside the Solana gaming ecosystem adds a steady demand source beyond pure speculation.
Bitcoin Market Direction
$SOL still trades with a strong correlation to Bitcoin. A risk-on Bitcoin environment tends to pull SOL higher faster than most other large caps. And a Bitcoin selloff would likely hit Solana harder too.
Risks to the Solana Price Prediction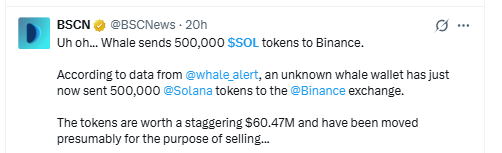
Bitcoin weakness, ETF outflows, token unlocks, and heavy futures positioning could derail this setup fast. Network competition lingers too. As per BSCN, a wallet reportedly moved 500,000 SOL ($60.47M) to Binance, a signal worth watching, not proof of a dump, per this bearish price outlook analysis.
$SOL Bull, Base and Bear Cases
Bull Case: ETF inflows keep accelerating, Bitcoin holds above key support, and SOL clears $145.73 with volume. This mirrors the setup behind Solana's recent seven-month price high, when ETF inflows first accelerated. That combination targets $210-$300 into early 2027.
Base Case: Inflows continue at a moderate pace, Bitcoin stays range-bound, and SOL chops between $96 and $150 while consolidating gains. This is the most likely path given current data.
Bear Case: ETF demand stalls, Bitcoin breaks down, and whale outflows to exchanges accelerate. SOL loses $96.55 and retests the $60-$80 zone.
$SOL Price Prediction 2026
Year-end range: $110 to $190, with a base case near $150; a level examined in this SOL hit $150 target breakdown. At roughly 600 million SOL in circulation by then, that implies a market cap between $66 billion and $114 billion, versus $72.82 billion today. Continuation depends on the channel breakout holding and ETF inflows staying steady.
$SOL Price Prediction 2027
Range: $150 to $320. Against an estimated 610 million circulating supply, that puts the market cap between $91.5 billion and $198 billion. Adoption metrics, especially stablecoin settlement, likely matter more than technicals by then.
$SOL Price Prediction 2028
Range: $180 to $420. With supply near 620 million, market cap works out to roughly $112 billion to $260 billion, tied closely to where the broader crypto cycle sits.
$SOL Price Prediction 2029
Range: $200 to $500. At an estimated 630 million supply, that's a market cap near $126 billion to $315 billion, assuming $SOL holds its competitive footing against rival layer-1 networks.
Solana Price Prediction 2030
Nobody can pin an exact number four years out. Three scenarios instead, using an estimated 645 million circulating supply:
Bear ($150-$250): market cap near $97 billion to $161 billion. Competition intensifies, ETF demand fades.
Base ($300-$600): market cap near $194 billion to $387 billion. Steady adoption, normal Bitcoin cycle.
Bull ($700-$1,200): market cap near $452 billion to $774 billion. $SOL becomes a dominant settlement layer for tokenized assets.
Can Solana Reach $200?
Yes, achievable within the current cycle. At today's supply, $200 implies roughly a $120 billion market cap, requiring a clear break above $175.91 first.
Can $SOL Reach $300?
Possible over a full cycle, near the prior all-time high of $294.33. At an estimated 610 million supply, $300 implies close to a $183 billion market cap.
Can Solana Reach $500?
A bull-case level for 2028-2029. At roughly 630 million supply, $500 implies near a $315 billion market cap, contingent on real-world asset and stablecoin share gains.
Can $SOL Reach $1,000?
Only in an aggressive, multi-year bull scenario. At an estimated 650 million supply, $1,000 implies close to a $650 billion market cap, well above any large-cap token today except Bitcoin and Ethereum. Not a near-term target.
What Could Invalidate the $SOL Forecast?
If SOL closes below $96.55 and fails to reclaim it within a few sessions, the near-term bullish thesis becomes invalid. If SOL closes below $80.00 on a weekly basis, the broader 2026 base case breaks down. If SOL closes below $60.14, the entire structural uptrend since May 2026 is void. Each of these levels represents a real line, not a guess.
Trader Takeaway
Above $127.29 with volume: bullish confirmation improves.
Between $96.55 and $127.29: wait for confirmation in either direction.
Below $96.55: downside risk increases meaningfully.
That's the map. What happens next depends on whether buyers show up at resistance or fade quietly.
Disclaimer
This article is for informational purposes only and does not constitute financial, investment, or trading advice. Cryptocurrency markets are volatile, and prices can move sharply in either direction. Historical patterns, technical levels, and forecasts referenced above are not guarantees of future performance. Anyone considering a trading or investment decision should conduct independent research and consult a qualified financial advisor before acting.

















