Silver Price Prediction: XAGUSD Crashed 4% To $63.91 What's next?

Silver price prediction (XAGUSD) is the question on everyone's mind after a rough couple of sessions wiped out weeks of gains in a single move.
What looked like a fairly calm uptrend suddenly turned sharp and ugly, and the timing was no accident.
A major policy decision landed right in the middle of it, and silver took the hit almost immediately. Here is exactly what happened, why it happened, and what the chart is showing now.
Why XAGUSD Crashed 4%: Fed Rate Hike and Sticky Inflation Explained
Yesterday's move traces directly back to the Federal Reserve's September policy meeting. On September 16, 2026, the FOMC voted 12 to 0 to raise the federal funds rate by 25 basis points, taking the target range to 3.75 to 4.00%.
In its statement, the committee said inflation remained elevated and that the hike would support a timelier return to its 2% goal.
Fed Chair Kevin Warsh struck a genuinely hawkish tone in the press conference, saying inflation had been too high for too long, and the Fed's updated dot plot pushed the median 2026 rate projection up to 4.1% from 3.8% back in June, effectively signaling one more hike could still be coming this year.
That hawkish combination, a hike plus guidance for more, sent the dollar higher and pushed short-term Treasury yields up sharply. Higher real yields raise the opportunity cost of holding non-yielding assets like silver, and the reaction was immediate.
Silver dropped below $64 an ounce, while gold fell roughly $100 to slip under $4,300, both metals getting squeezed by the same rate mechanism at the same time.
Feeding into all of this was the latest CPI report. The August 2026 Consumer Price Index, released on September 11, showed headline inflation up 0.4% in the month and 3.4% year over year, while the core CPI, which strips out food and energy, rose 0.3% monthly and held at 2.4% annually, still comfortably above the Fed's 2% target.
That stubborn inflation print is exactly what gave the Fed cover to hike and sound hawkish about it, and it is the underlying reason silver's selloff has had real follow-through rather than fading within a day.
Source: Federal Reserve press release, September 16, 2026; U.S. Bureau of Labor Statistics CPI report, September 11, 2026.
Silver Price Today: Live Data and 24-Hour Change
Silver is trading around $63.91 right now, down 0.91% over the past 24 hours, still digesting the sharper drop from the FOMC reaction a day earlier.
Market cap for the tracked derivatives contract sits at $256.03 billion, with total supply listed at 56 billion XAG units and a self-reported circulating supply of 4 billion XAG.
Source: coin/derivatives data snapshot, September 17, 2026.
Silver Technical Forecast: Reading the Trendline Breakdown on XAGUSD
Chart source: TradingView, XAG/USD, 1-hour timeframe, OANDA, September 17, 2026, 15:40 UTC+5:30.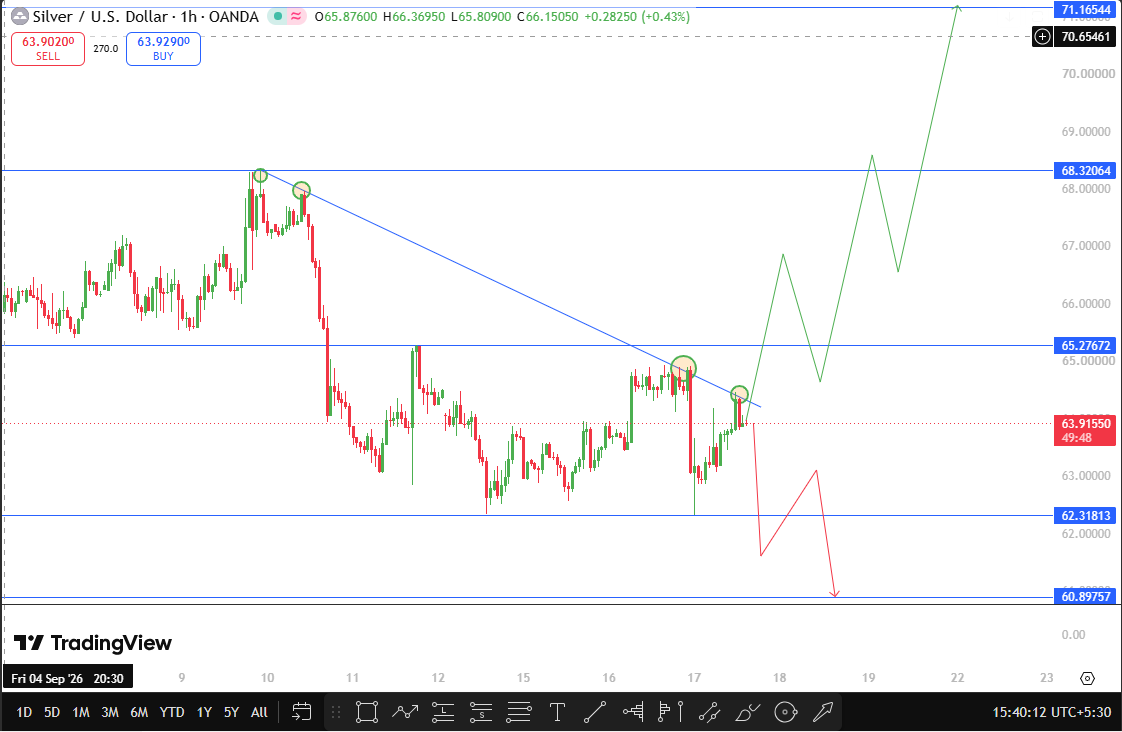
Zooming into the 1-hour XAGUSD chart, silver had been climbing steadily before topping out and forming a descending trendline connecting a series of lower highs.
Price has since broken down below that trendline and is now trading beneath it, currently sitting around $63.915, right in between the two nearest marked levels on the chart.
For silver to challenge this trendline again, price would need to close back above $65.27672. Reclaiming that level would open the path toward $68.32064, and a stronger recovery from there could extend toward $70.65461.
On the downside, if silver closes below $62.31813, that would confirm the breakdown is continuing rather than stabilizing. In that case, the next support to watch drops to $60.89757.
XAGUSD Support and Resistance Levels
Level Type | Price |
Resistance 2 | $71.16544 |
Resistance 1 | $68.32064 |
Trendline Reclaim Level | $65.27672 |
Current Price | $63.915 |
Support 1 | $62.31813 |
Support 2 | $60.89757 |
Risks to This Silver Price Prediction
The biggest risk here is that this is a genuine macro-driven move, not a pure technical setup, and macro conditions can shift fast.
If upcoming data suggests inflation is cooling faster than expected, or if the Fed's tone softens at future meetings, silver could recover ground quickly.
On the other hand, another hot inflation print or continued hawkish signals from the Fed could extend this selloff well beyond current support levels.
Broader risk appetite, dollar strength, and Treasury yield moves will likely matter more than the chart pattern alone in the days ahead.
Disclaimer
This article is for informational purposes only and should not be considered financial advice. Silver price prediction figures and technical analysis shared here are based on chart patterns and publicly available data at the time of writing. Precious metals and commodity markets can move sharply in either direction without warning, especially around major economic events. Always do your own research and consult a qualified financial advisor before making any investment decisions.


















