Stable Price Prediction: $STABLE Forecast, Analysis and StableHub 2.0


$STABLE has been a tough chart to trust for months. Now the token is pressing against a ceiling that has capped recent bounces, and traders are asking whether the pressure is finally easing.
The Stable price prediction now hinges on one simple test: can buyers turn that ceiling into support?
What Is the $STABLE Price Today?
According to Coinglass , the $STABLE price today is $0.02591, up 4.56% in 24 hours, with a market cap of $692.81M and a spot volume of $3.87M.
Circulating supply stands at 26.59B tokens against a 100.00B total and maximum supply, so roughly a quarter of tokens are in the market.
What Does StableHub 2.0 Mean for the $STABLE Ecosystem?
The project announced on X that StableHub 2.0 is now live. The redesigned interface brings balance tracking, transfers, StableEarn access, and ecosystem exploration into one place.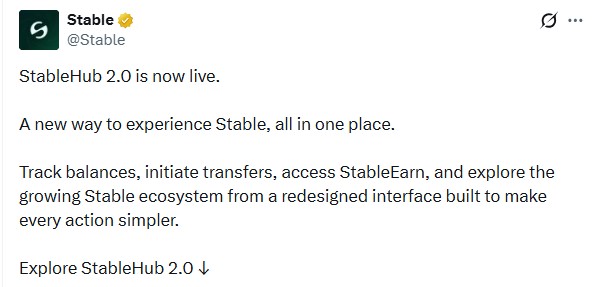
Upgrades like this can widen attention, but the market will still want to see real usage follow.
How Concentrated Is $STABLE Holder Distribution?
Stablescan holder data shows extreme whale concentration. The top 100 wallets account for 99.99% of market value, the top five hold 89.54%, and the top ten 94.61%, while seven holders own at least 1% of supply each.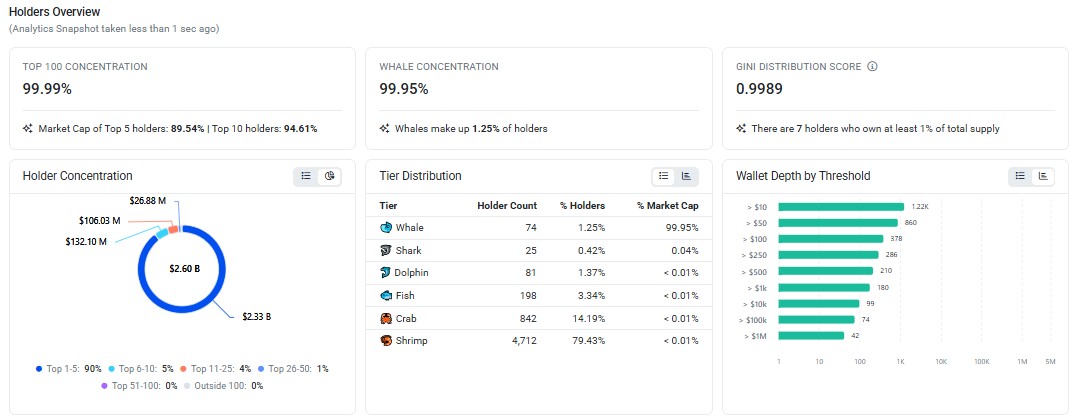
The Gini score of 0.9989 is near its maximum. Whales are only 74 wallets, or 1.25% of holders, yet control 99.95% of value.
With Stable holder distribution, this is uneven; a few wallets can move price, so large transfers deserve attention.
How Are Traders Positioned in $STABLE After a Weak Month?
Coinglass performance data shows Stable up 4.55% over 24 hours and 6.99% over seven days, but down 11.60% over 30 days and 29.01% over 90 days, so the bounce sits inside a broader slide.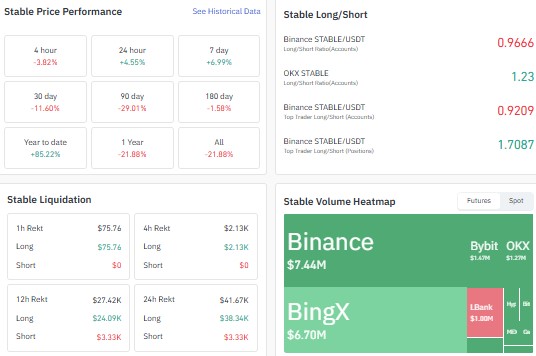
The Binance STABLE/USDT long short ratio reads 0.97, top trader accounts sit at 0.92, and top trader positions at 1.71, while OKX shows 1.23.
That is mixed, with account-based readings slightly short and larger positions leaning long.
Liquidations are small at $41.67K over 24 hours, with longs at $38.34K and shorts at $3.33K, so leverage is not driving the move.
Why Is $STABLE Open Interest Falling While Price Bounces?
Coinglass shows open interest at $8.44M, down from roughly $19M in late August, so participation has more than halved during the downtrend.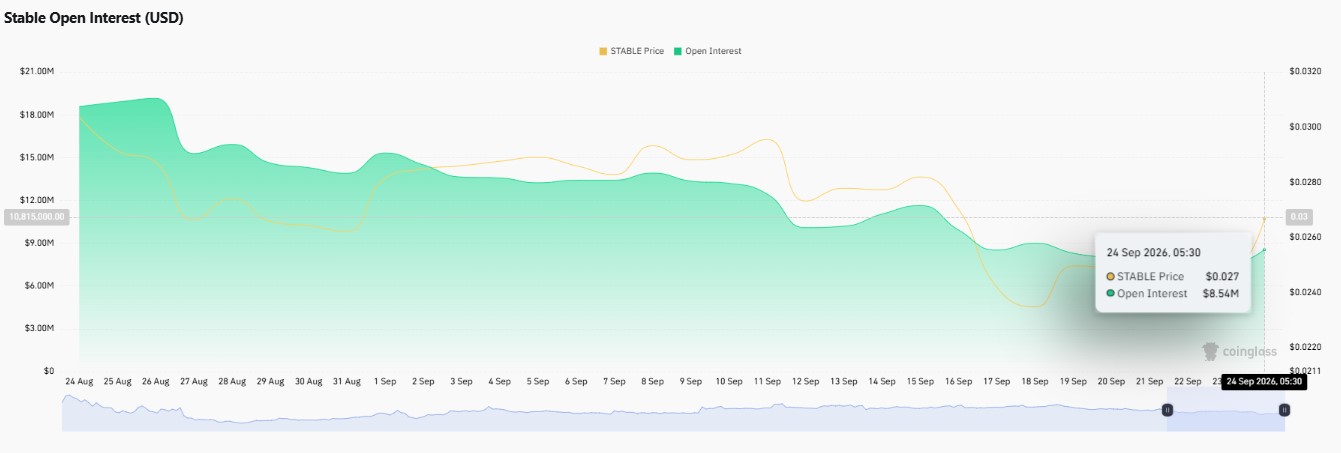
Futures volume of $19.28M is about five times spot volume, so derivatives still dominate trading.
A bounce on thinner positioning looks like cautious buying rather than a leveraged push, so follow-through needs fresh participation.
$STABLE Daily Chart Analysis: Descending Channel Ready to Break?
Per TradingView chart data, token has traded inside a descending channel since late July, when the price rolled over from the $0.04 area.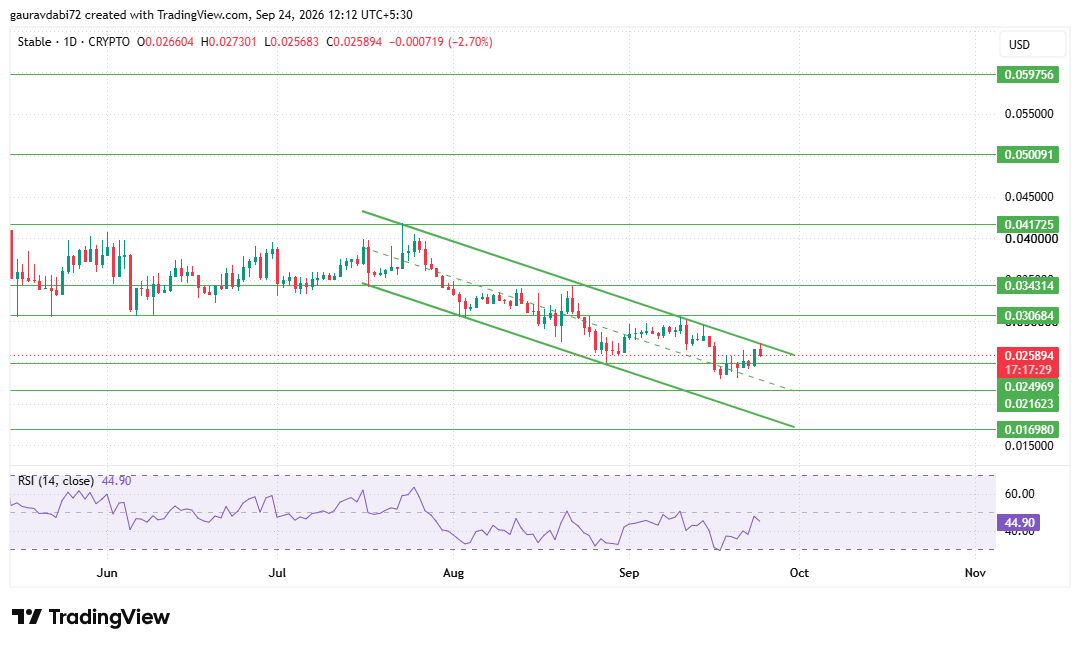
Each bounce has stalled near the upper trendline, and price is testing it again. The $STABLE support and resistance levels are clear.
A daily close above the trendline that holds would be the first sign the pattern is breaking, and a $STABLE descending channel breakout would open resistance at $0.030684, $0.034314, $0.041725, $0.050091, and $0.059756.
Until then, support sits at $0.024969, followed by $0.021623 and $0.016980. A rejection keeps the sequence of lower highs intact.
What Could the Stable Price Prediction Look Like Next Week?
For the Stable price prediction next week, the upper trendline decides the path.
| Scenario | Trigger | Key Levels |
| Bullish | Daily close above the upper channel line, then a hold | $0.030684, then $0.034314 |
| Neutral | Rejection at the trendline with support intact | Range from $0.024969 to the channel line |
| Bearish | Daily close below $0.024969 | $0.021623, then $0.016980 |
Which Risks Could Keep Stable Under Pressure?
Concentrated ownership means one large seller could break the setup. Open interest has shrunk, and a failed trendline test would extend the lower highs.
Is Stable Ready to Turn? Analyst Desk View
As per the CoinGabbar analyst desk, $STABLE is at a decision point rather than a confirmed trend change.
The hub upgrade and the bounce give buyers a reason to try, but heavy whale concentration and shrinking positioning argue for waiting for a confirmed hold above the trendline.
Conclusion
The Stable price prediction rests on the upper channel line. A hold above it opens resistance from $0.030684, while rejection keeps the price between $0.024969 and the trendline.
Disclaimer: This article is for informational purposes only and is not financial advice. Crypto prices are highly volatile, so consult a qualified advisor before investing.

















