PAX Gold Price Prediction: Can $4,250 Key Support Push PAXG to $5K?


PAXG has declined for two straight weeks and is now sitting right on the support zone that has held since early August.
This PAX Gold Price Prediction looks at whether $4,250 holds one more time or whether this is the break that finally sends PAXG looking for a new floor.
PAX Gold Technical Analysis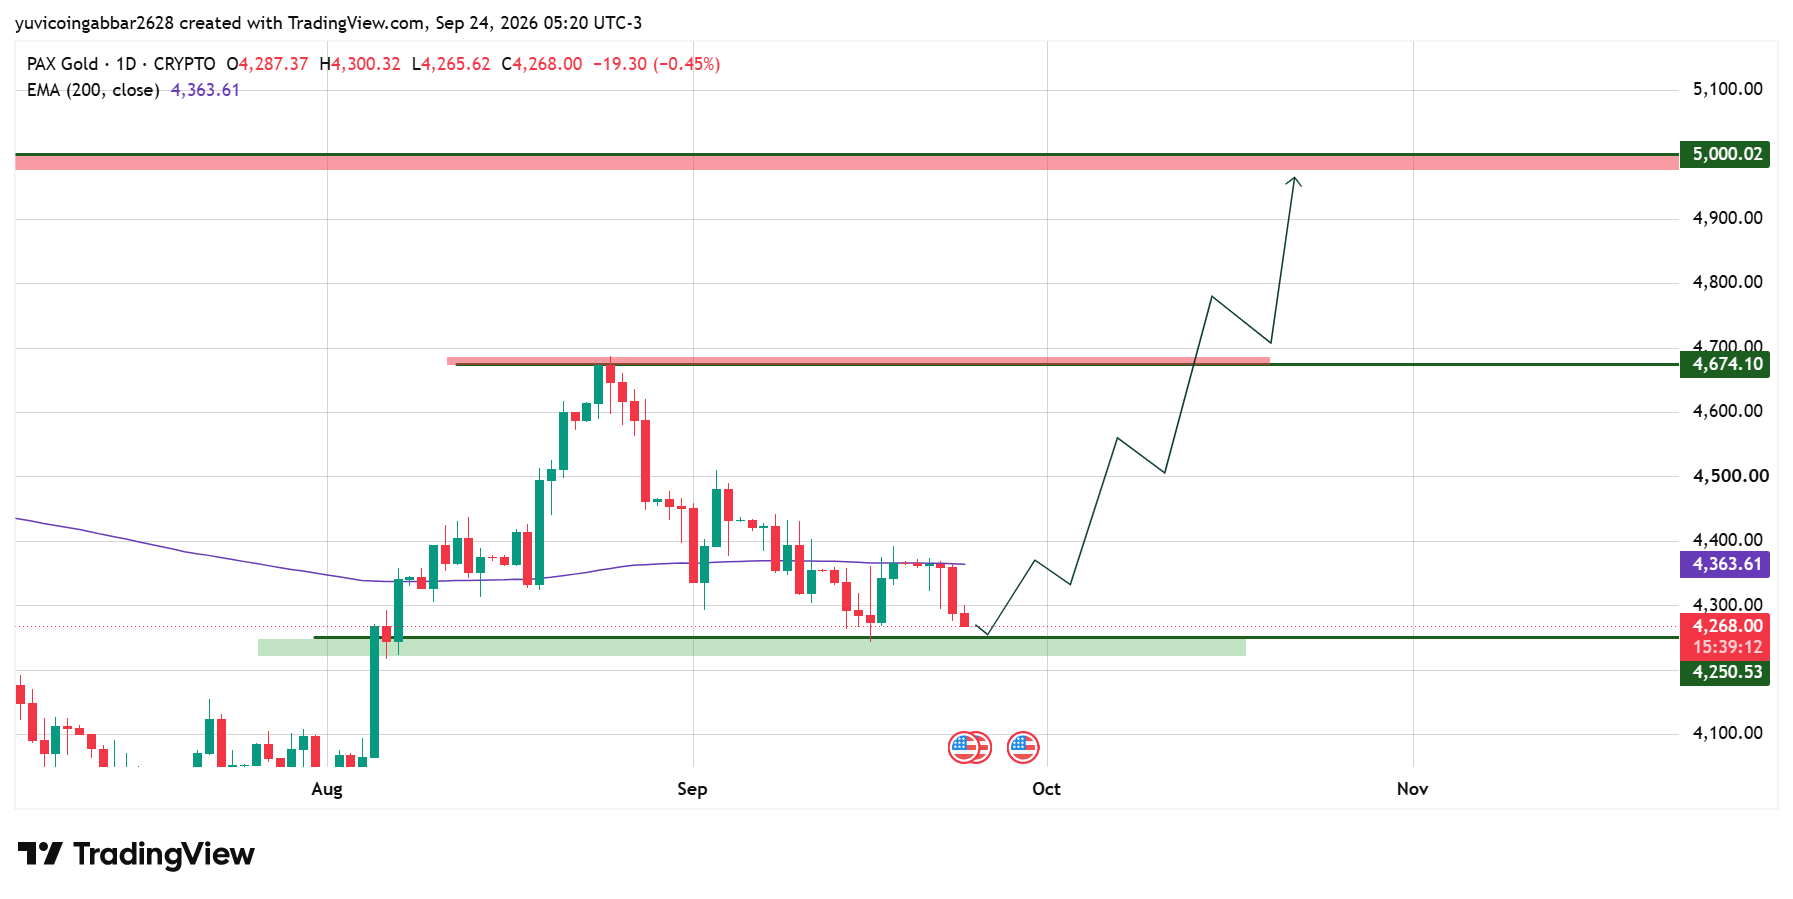
PAX Gold price today is trading at $4,268 with a -2% decline. PAXG rallied from around $4,050 in early August to a high near $4,670 in early September, then reversed into a steady two-week decline that has taken the price back below the 200 EMA.
That slide has slowed right at the $4,250 support zone, the same area that acted as a launchpad for the August rally.
Gold Price Today IMP Key Levels
Level Type | Price |
Resistance 2 | $5,000.02 |
Resistance 1 | $4,674 |
EMA 200 | $4,363.61 |
$4,268 | |
Key Support | $4,250 |
The PAX Gold Forecast
Bull case: Holding above $4,250 and reclaiming the 200 EMA at $4,363.61 would suggest this pullback is stabilising rather than turning into a deeper breakdown.
A confirmed close back above $4,674 would reopen the path toward $5,000.
Bear case: A close below $4,250 would break a support zone that has held since early August and put the broader uptrend in real doubt.
That kind of breakdown would leave PAXG without a clearly marked floor on this chart until much lower levels.
Gold Price Prediction: Can PAXG Reach $5,000?
$5,000 is the highest resistance level marked on the chart. Reaching it would require PAXG to first reclaim the 200 EMA and then clear $4,674.10, a recovery that realistically needs the current support test to hold first.
PAX Gold Price Prediction 2026: Expert View
According to CoinGabbar analysts, the two-week slide has been gradual rather than sharp, and the price is now testing a level that has proven reliable before, which is a more constructive setup than a fresh breakdown would be.
Still, $4,250 has only been tested once before, on the way up, so a hold here on the way down is a genuinely different test, and that close is the signal to watch rather than today's small daily move.
Disclaimer
This piece is for informational purposes only and isn't financial advice. The levels and scenarios above are based on technical chart analysis and publicly available data at the time of writing, and gold-linked assets can move sharply on macro and currency news, so past patterns don't guarantee future outcomes. It's worth doing independent research and considering your own risk tolerance before acting on any of the levels discussed here.

















